ComfortDelgro: Bullish Abandoned Baby Reversal

  • Post author:

ComfortDelgro rebounded from an uptrend support with Bullish Abandoned Baby (Morning Doji Star) Reversal Pattern.

ComfortDelgro July10-2015

Learn how to identify trend reversal using candlestick patterns, check out the Technical Analysis Hands on class here.

ComfortDelgro Fundamental Data

  • Last Done Price = $3.03
  • Market Cap = 6.49 B
  • EPS = $0.13234
  • PE Ratio (TTM) = 22.61
  • PE High (Last 5 Years) = 19.65
  • PE Low (Last 5 Years) = 12.57
  • P/B Ratio = 2.8634
  • Dividend Yield = 2.719%
  • ROA = 5.42%
  • ROE = 12.95%
  • Current Ratio = 0.985

Learn how to use Financial Ratio to analyse the stocks, check out the Fundamental Analysis class (hands on research) here.

Fundamentally ComfortDelgro seems average but over value. Technically there is a trading opportunity for a short term bullish trade but not for long term investment.

Continue ReadingComfortDelgro: Bullish Abandoned Baby Reversal

Yangzjiang Shipbuilding Holding: Rebound from 200D SMA Support

  • Post author:

Yangzijiang rebounded from the 200D SMA support and also the uptrend line support after recent sell down.

2015July10-Yangzijiang-800x600

To learn how to use chart patterns to identify trading opportunities, check out the Technical Analysis Hands on class here.

Yangzijiang Fundamental

  • Last Done Price = $1.315
  • Market Cap = 5.038 B
  • EPS = $0.1937
  • PE Ratio = 6.789
  • PE High (Last 5 Years) = 12.29
  • PE Low (Last 5 Years) = 4.26
  • P/B Ratio = 1.0739
  • Dividend Yield = 4.183%
  • ROA = 8.541%
  • ROE = 17.012%
  • Current Ratio = 1.677

Learn how to use Financial Ratio to analyse the stocks, check out the Fundamental Analysis class (hands on research) here.


Fundamentally and Technically Yangzijiang Shipbuilding looks good to long at this level.

Continue ReadingYangzjiang Shipbuilding Holding: Rebound from 200D SMA Support

SingPost: Trend Reversal to Up Trend

  • Post author:

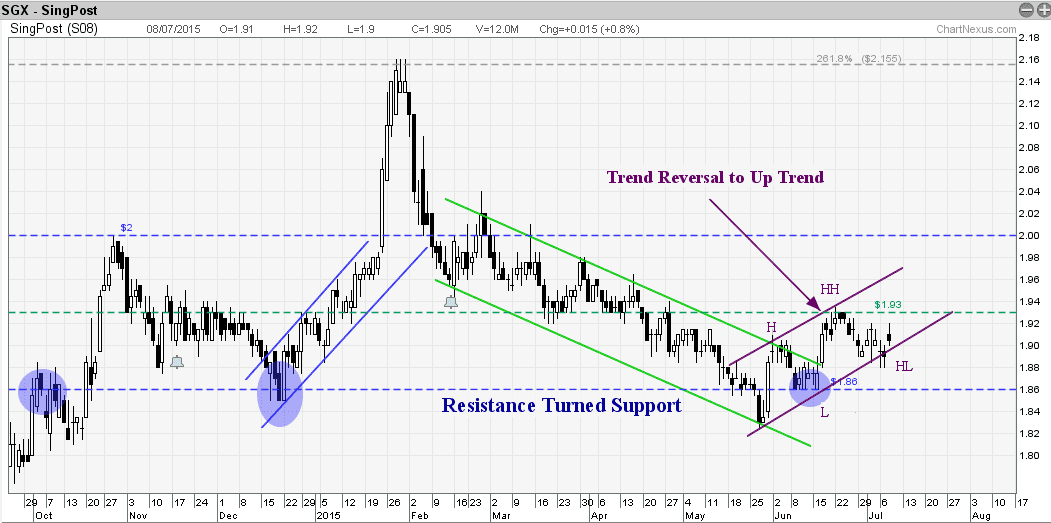
Base on the current chart pattern, SingPost has reversed from the down trend and started an uptrend. SingPost is currently trading in an Up Trend Channel and forming a “Higher High, Higher Low” Up Trend pattern. A good candidate to hedge (long trade) with other bearish short position on other stocks.

SingPost July8-2015

To learn how to use chart patterns to identify trading opportunities, check out the Technical Analysis Hands on class here.

SingPost Fundamental

  • Last Done Price = $1.915
  • EPS = $0.06645
  • PE Ratio = 28.89
  • XD Date = July 13, 2015 ($0.0325)
  • Dividend Yield = 3.253%
  • ROA = 6.495%
  • ROE = 12.776%
  • Current Ratio = 1.922

Learn how to use Financial Ratio to analyse the stocks, check out the  Fundamental Analysis class (hands on research) here.

Continue ReadingSingPost: Trend Reversal to Up Trend