STI : End of Elliott Wave 5. Big correction is coming?

  • Post author:

I am very tempted to pick up some stocks this week after seeing some selling off. However, I changed my mind and decided to ENDURE and wait for the big correction. I have to be very disciplined for these two months.

STI had completed the Elliott Wave 5 and started the correction. The next support will be probably around 2420 points (61.8% Fibonacci retracement of Wave 5).

The index will probably retrace back to 2220 points (61.8% retracement of full Elliot Wave 1- 5), ie. there is another 300 points to go! STI is really looking bearish, isn’t it? However, it is a good news for those who have missed the April-July rally. I am loaded, and I am ready to go!

Continue ReadingSTI : End of Elliott Wave 5. Big correction is coming?

Capitaland DOUBLE TOPS formation – Down Trend started?

  • Post author:

A double tops had been formed on Capitaland indicating the trend reversal. In addition, all Standard Six Indicators are showing bearish convergence. Capitaland closed at $3.63 today with hanging man candle. Stock price broke the 20D & 50D MA support and at the lower end of Bollinger Band. MACD is very close entering bearish convergance at lower half, RSI & Stochastic are showing bearish convergence as well. All technical indicators showed that down trend is going to start. I am sitting back, relax and wait for the big correction before I long this stock. I hope I am right!

Continue ReadingCapitaland DOUBLE TOPS formation – Down Trend started?

Courage Marine – is it getting bullish?

  • Post author:

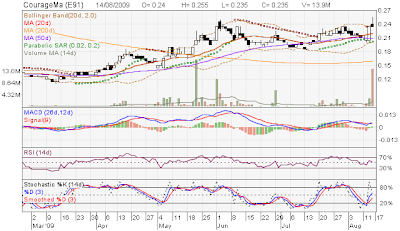
This week this counter has a very long marubozu candle and close the week at $0.235 with a volume spike of 13.9M shares traded in one day (on Aug 14). Standard Six Technical Indicators are signaling short term bullish convergence.

Week TA Summary
* Stock price above 20D, 50D and 200D MA and all three MAs are in uptrend. 20D MA crossed 50D MA.
* Stock price on the upper boundary of Bollinger Band.
* MACD crossover (blue over red) on upper half showing bullish convergence.
* Stock price on top of Parabolic SAR.
* RSI at 55%.
* Stochastic blue-red crossover in the up trend.

The chart is also having a very nice Fibonacci retracement back to $0.197 (61.8%) and should form a very strong support line. If the stock price can break the resistance of $0.25 and stay on top of $0.25 with healthy volume, it may go all the way up to $0.337 (161.8%) by Jan 2010 base on Fibonacci fan.

Stock Background
3 Years Historical High = $0.51
Current Price = $0.235
Continue ReadingCourage Marine – is it getting bullish?