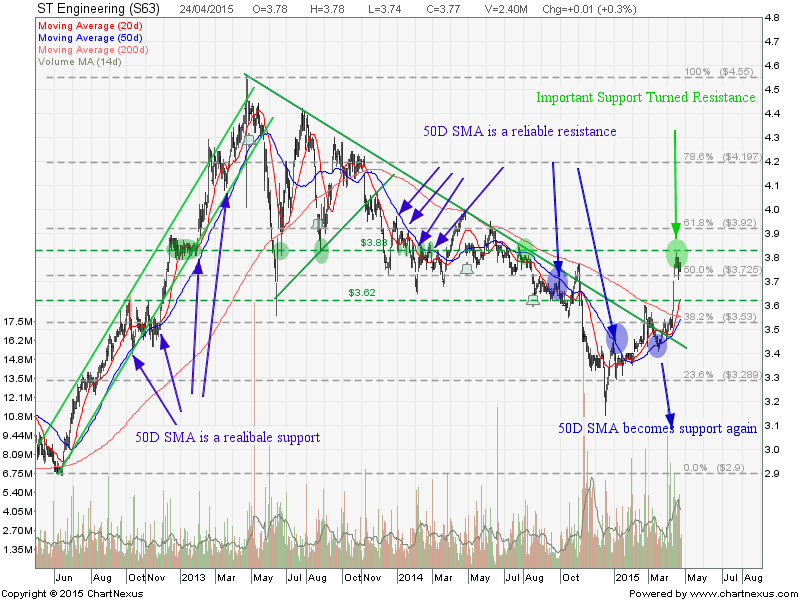
ST Engineering: Trend Reversal
ST Engineering has broken out from the Down Trend line resistance and is showing sign of reversal pattern. Currently ST Engineering has moved above all the 3 Moving Averages but rejected at the previous support turned resistance at about $3.83. Base on the previous chart pattern, 50D SMA seems to be a reliable support and resistance when ST Engineering is trending. Wait for the pull back to 50D SMA and watch for reversal candlestick for Long position.
Original post by Marubozu My Stocks Investing Journey.
| Current P/E Ratio (ttm) | 22.0985 |
|---|---|
| Estimated P/E(12/2015) | 20.6011 |
| Relative P/E vs. FSSTI | 1.5647 |
| Earnings Per Share (SGD) (ttm) | 0.1706 |
| Est. EPS (SGD) (12/2015) | 0.1830 |
| Est. PEG Ratio | 5.4213 |
| Market Cap (M SGD) | 11,723.04 |
| Shares Outstanding (M) | 3,109.56 |
| 30 Day Average Volume | 3,576,230 |
| Price/Book (mrq) | 5.5130 |
| Price/Sale (ttm) | 1.7979 |
| Dividend Indicated Gross Yield | 2.12% |
| Cash Dividend (SGD) | 0.0700 |
| Dividend Ex-Date | 04/27/2015 |
| 5 Year Dividend Growth | 0.82% |
| Next Earnings Announcement | 05/13/2015 |