Semb Marine: Breakout from Descending Triangle?

  • Post author:

Looks like Semb Marine is breaking out from Descending Triangle and the 50D SMA resistance. This 50D SMA used to be a tough resistance for past 5 occasions. Immediate resistance at $3.30 followed by the 200D SMA. Immediate support is the 50D SMA.

2015Apr14-SembMar-800x600

Original post by Marubozu My Stocks Investing Journey.

Current P/E Ratio (ttm) 11.4051
Estimated P/E(12/2015) 11.6350
Relative P/E vs. FSSTI 0.8142
Earnings Per Share (SGD) (ttm) 0.2683
Est. EPS (SGD) (12/2015) 0.2630
Est. PEG Ratio 5.8030
Market Cap (M SGD) 6,391.54
Shares Outstanding (M) 2,088.74
30 Day Average Volume 2,905,500
Price/Book (mrq) 2.1566
Price/Sale (ttm) 1.0958
Dividend Indicated Gross Yield 4.25%
Cash Dividend (SGD) 0.0800
Dividend Ex-Date 04/27/2015
5 Year Dividend Growth 3.40%
Next Earnings Announcement 04/27/2015
Continue ReadingSemb Marine: Breakout from Descending Triangle?

DBS: Stock Price Topping Chart Patterns

  • Post author:

DBS is currently consolidating in a Ascending Triangle and showing a Double Tops (a trend reversal) chart pattern, although the uptrend is still intact. Cautious needed for investors who are still holding DBS shares.

Original post by Marubozu My Stocks Investing Journey.

2015 April10-DBS

Current P/E Ratio (ttm) 12.4225
Estimated P/E(12/2015) 11.9255
Relative P/E vs. FSSTI 0.8899
Earnings Per Share (SGD) (ttm) 1.6502
Est. EPS (SGD) (12/2015) 1.7190
Est. PEG Ratio 1.0648
Market Cap (M SGD) 50,815.25
Shares Outstanding (M) 2,478.79
30 Day Average Volume 3,695,893
Price/Book (mrq) 1.3733
Price/Sale (ttm) 3.9612
Dividend Indicated Gross Yield 2.83%
Cash Dividend (SGD) 0.3000
Dividend Ex-Date 04/27/2015
5 Year Dividend Growth 0.70%
Next Earnings Announcement 04/27/2015
Continue ReadingDBS: Stock Price Topping Chart Patterns

Mapletree Com Trust: Reaching Historical High!

  • Post author:

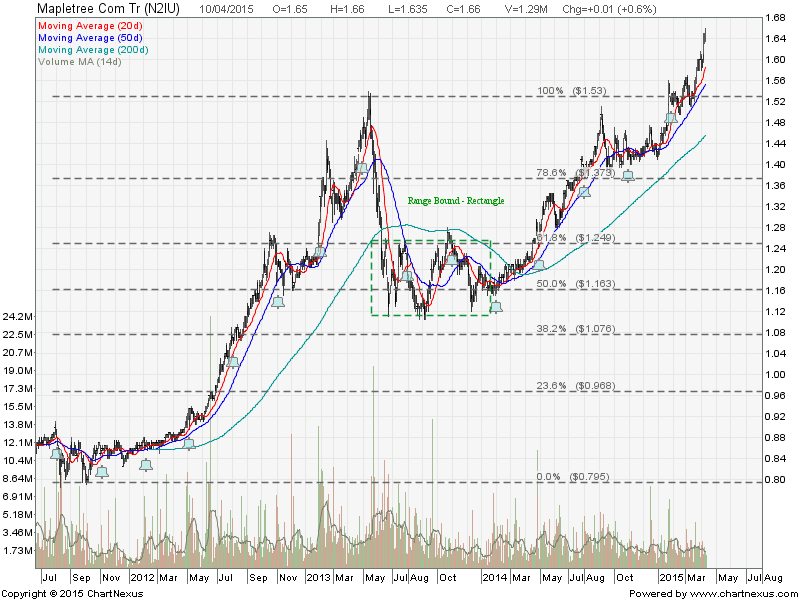
Mapletree Com Trust Share Price, Fundamental and Technical Analysis.

Mapletree Com share price reaches historical high and still on an uptrend! Fundamentally Mapletree is over value base on NAV; relatively high Gearing ratio and average distribution yield compares to other Singapore REIT. See other Singapore REIT comparison table here.

Sit tight and watch the show!

Mapletreecom REIT April10-2015

  • Last Done Price = $1.66
  • NAV = $1.17
  • Price /  NAV = 1.418 (41.8% Premium)
  • Price /  NAV (High) = 1.445
  • Price /  NAV (Low) = 1.044
  • Distribution Yield = 5.012%
  • Gearing Ratio = 37.9%
Continue ReadingMapletree Com Trust: Reaching Historical High!