Global Logistic Properties (GLP): Trading in a Channel

  • Post author:

Global Logistic Properties (GLP) is currently trading in a channel. Looks like GLP is facing a channel resistance and 200D SMA. A potential high Risk vs Reward trade on this chart pattern.

2015April1-GLOBAL LOGISTIC PROP LIMITED-800x600

Current P/E Ratio (ttm) 18.3574
Estimated P/E(03/2015) 31.9298
Relative P/E vs. FSSTI 1.3247
Earnings Per Share (USD) (ttm) 0.1061
Est. EPS (USD) (03/2015) 0.0610
Est. PEG Ratio 3.4915
Market Cap (M SGD) 12,874.15
Shares Outstanding (M) 4,839.91
30 Day Average Volume 13,060,400
Price/Book (mrq) 1.0694
Price/Sale (ttm) 13.5376
Dividend Indicated Gross Yield 1.69%
Cash Dividend (SGD) 0.0450
Dividend Ex-Date 07/22/2014
5 Year Dividend Growth
Next Earnings Announcement 05/22/2015
Continue ReadingGlobal Logistic Properties (GLP): Trading in a Channel

CapitaMall Trust Fundamental & Technical Analysis

  • Post author:
  • Fundamental Analysis of CapitaMall Trust:
  • Type: Retail + Office
  • Last Price = $2.09
  • Market Cap: $7.34 Billion
  • NAV = $1.79
  • Price / NAV = 1.17
  • Price / NAV (52 Weeks High) = 1.3913
  • Price / NAV (52 Weeks Low) = 1.0508
  • Distribution Yield = 5.43%
  • Gearing Ratio = 33.8%
  • Occupancy Rate = 98.8%
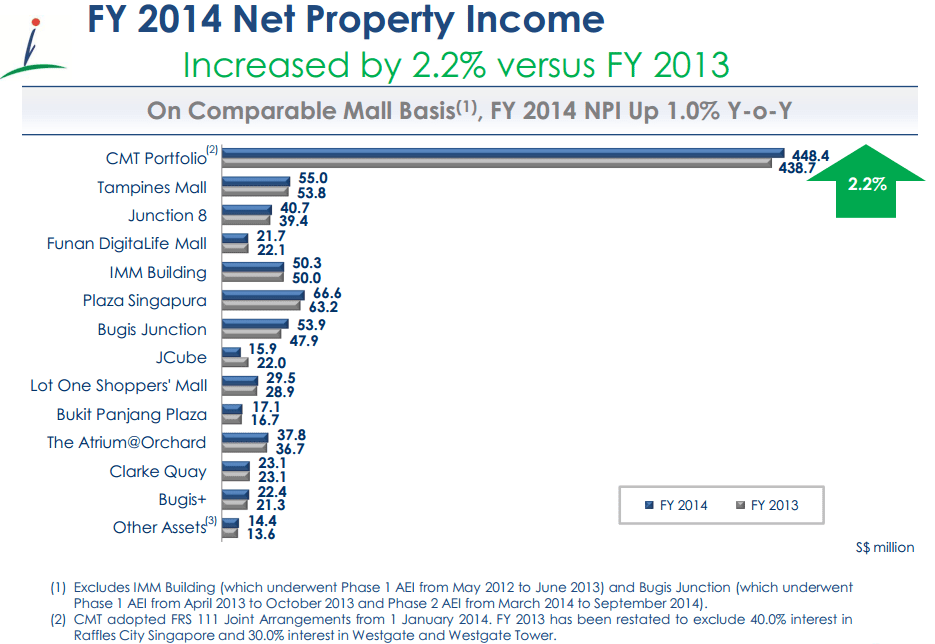
  • CapitaMall Trust FY14 Presentation.

Other Singapore REIT Comparison Table.

CMT NPI By Portfolio FY14CMT 2015 Lease Expiry FY14CMT WADM FY14

Technically CapitaMall Trust is on the up trend but getting to all time high of $2.23. Upside is limited base on valuation, distribution yield and stock chart.

2015Feb17-CapitaMall-800x600

Continue ReadingCapitaMall Trust Fundamental & Technical Analysis

SembCorp: Consolidation to Down Side

  • Post author:

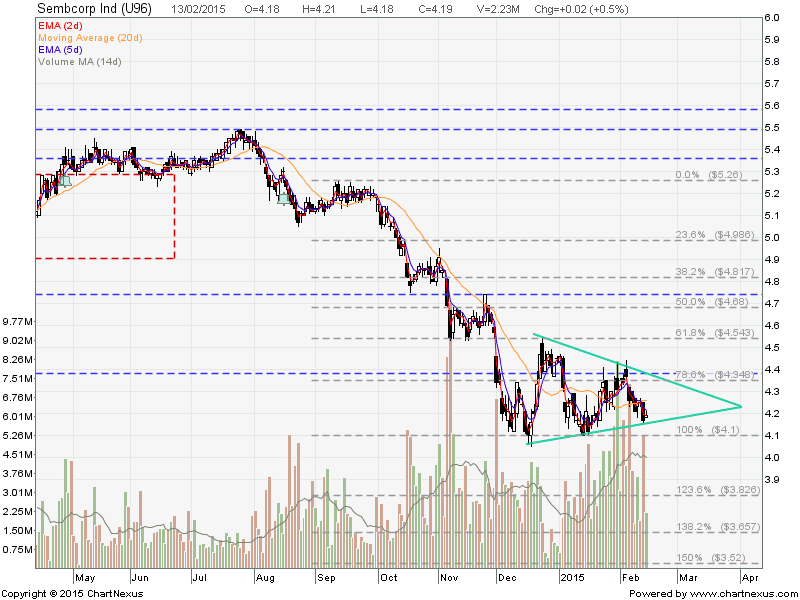
SembCorp is currently consolidating in a Symmetrical Triangle and still on the down trend.

2015Feb14-SembCorp-800x600

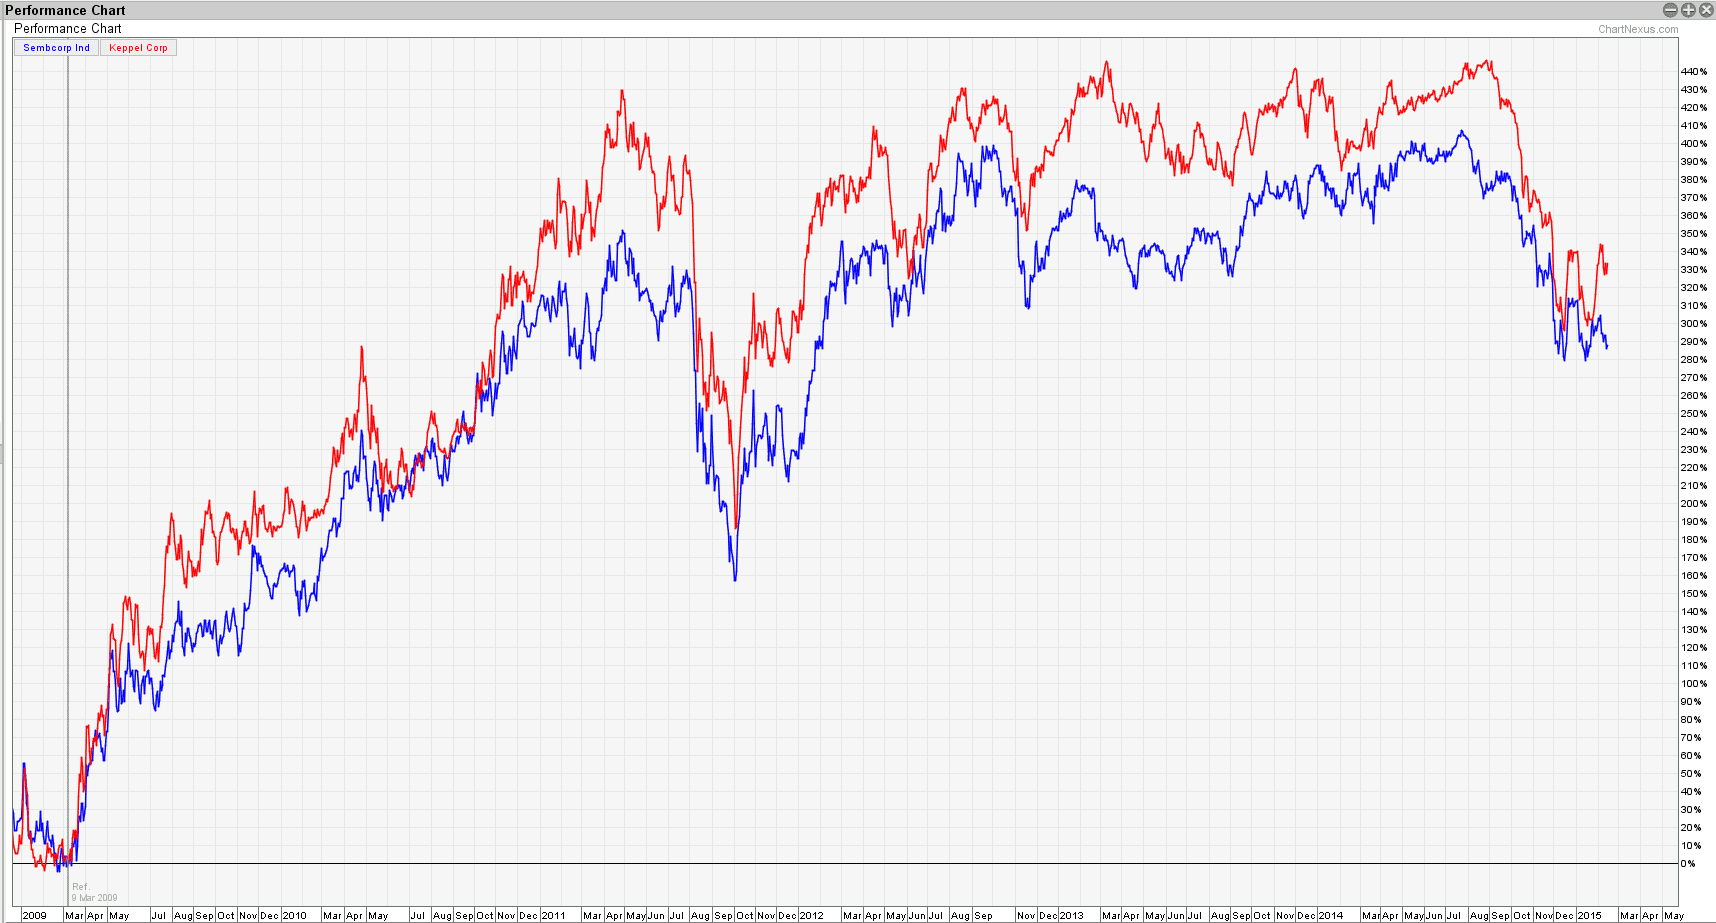
Potential Hedging Pair trade with KepCorp which has shown a trend reversal pattern of Double Bottoms. Long KepCorp and Short SembCorp.

2015 Feb14 KepCorp SembCorp Pair

Current P/E Ratio (ttm) 9.6611
Estimated P/E(12/2014) 9.6767
Relative P/E vs. FSSTI 0.6989
Earnings Per Share (SGD) (ttm) 0.4337
Est. EPS (SGD) (12/2014) 0.4330
Est. PEG Ratio 1.4443
Market Cap (M SGD) 7,475.11
Shares Outstanding (M) 1,784.04
30 Day Average Volume 3,735,873
Price/Book (mrq) 1.4408
Price/Sale (ttm) 0.6679
Dividend Indicated Gross Yield 1.19%
Cash Dividend (SGD) 0.0500
Dividend Ex-Date 08/15/2014
5 Year Dividend Growth 14.87%
Next Earnings Announcement 02/17/2015
Continue ReadingSembCorp: Consolidation to Down Side