Hedging Pair: UOB vs OCBC

  • Post author:

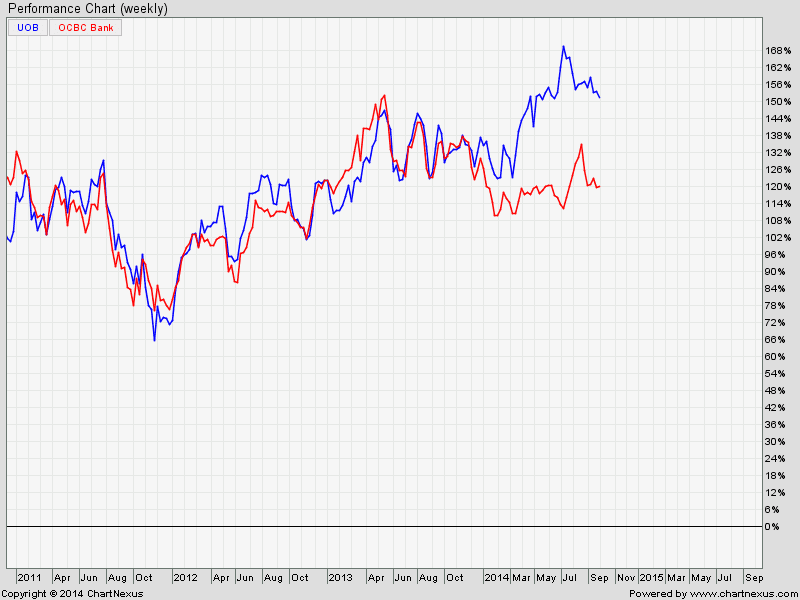
Establishing the correlation for UOB and OCBC as part of the Hedging Strategy for Singapore Stocks. Performance Charts with reference to Mar 9, 2009.

OCBC UOB Oct5-2014

Original Post by Marubozu My Stocks Investing Journey


UOB (United Overseas Bank)

2014Oct5-UOB-800x600

Current P/E Ratio (ttm) 11.8255
Estimated P/E(12/2014) 11.8542
Relative P/E vs. FSSTI 0.8722
Earnings Per Share (SGD) (ttm) 1.8976
Est. EPS (SGD) (12/2014) 1.8930
Est. PEG Ratio 1.5101
Market Cap (M SGD) 35,934.34
Shares Outstanding (M) 1,601.35
30 Day Average Volume 1,441,033
Price/Book (mrq) 1.2791
Price/Sale (ttm) 3.8184
Dividend Indicated Gross Yield 3.12%
Cash Dividend (SGD) 0.2000
Dividend Ex-Date 08/18/2014
5 Year Dividend Growth 4.56%
Next Earnings Announcement 10/30/2014

.

OCBC (Oversea-Chinese Banking Corp)

2014Oct5-OCBC Bk-800x600

Current P/E Ratio (ttm) 10.6491
Estimated P/E(12/2014) 11.0556
Relative P/E vs. FSSTI 0.7854
Earnings Per Share (SGD) (ttm) 0.9146
Est. EPS (SGD) (12/2014) 0.8810
Est. PEG Ratio 1.2353
Market Cap (M SGD) 38,272.55
Shares Outstanding (M) 3,929.42
30 Day Average Volume 5,418,767
Price/Book (mrq) 1.3712
Price/Sale (ttm) 3.5868
Dividend Indicated Gross Yield 3.49%
Cash Dividend (SGD) 0.1750
Dividend Ex-Date 08/25/2014
5 Year Dividend Growth 4.56%
Next Earnings Announcement 10/30/2014
Continue ReadingHedging Pair: UOB vs OCBC

Hedging Pair: Keppel Corp vs SembCorp

  • Post author:

Establishing the correlationship for Keppel Corp and SembCorp as part of the Hedging Strategy for Singapore Stocks. Performance Charts with reference to Mar 9, 2009.

KepCorp SembCorp Oct5-2014

Original Post by Marubozu My Stocks Investing Journey

Keppel Corp

2014Oct5-KepCorp-800x600

Current P/E Ratio (ttm) 9.9712
Estimated P/E(12/2014) 12.0510
Relative P/E vs. FSSTI 0.7354
Earnings Per Share (SGD) (ttm) 1.0430
Est. EPS (SGD) (12/2014) 0.8630
Est. PEG Ratio 2.4345
Market Cap (M SGD) 18,898.39
Shares Outstanding (M) 1,817.15
30 Day Average Volume 2,579,767
Price/Book (mrq) 1.8956
Price/Sale (ttm) 1.4800
Dividend Indicated Gross Yield 4.04%
Cash Dividend (SGD) 0.1200
Dividend Ex-Date 07/31/2014
5 Year Dividend Growth 5.12%
Next Earnings Announcement 10/21/2014

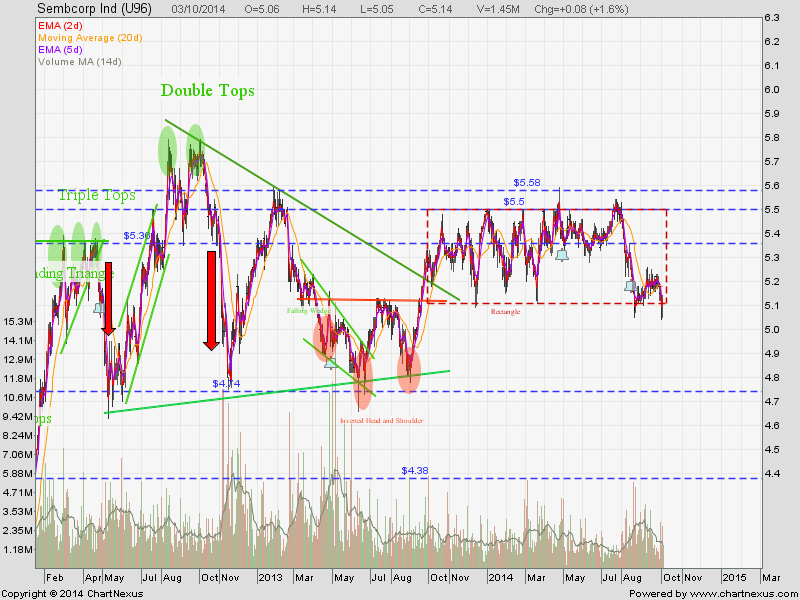
SembCorp

2014Oct5-SembCorp-800x600

Current P/E Ratio (ttm) 11.0159
Estimated P/E(12/2014) 11.5506
Relative P/E vs. FSSTI 0.8125
Earnings Per Share (SGD) (ttm) 0.4666
Est. EPS (SGD) (12/2014) 0.4450
Est. PEG Ratio 1.3126
Market Cap (M SGD) 9,185.24
Shares Outstanding (M) 1,787.01
30 Day Average Volume 1,962,800
Price/Book (mrq) 1.8005
Price/Sale (ttm) 0.8262
Dividend Indicated Gross Yield 0.97%
Cash Dividend (SGD) 0.0500
Dividend Ex-Date 08/15/2014
5 Year Dividend Growth 14.87%
Next Earnings Announcement 11/06/2014
Continue ReadingHedging Pair: Keppel Corp vs SembCorp

SGX: On Up Trend But….

  • Post author:

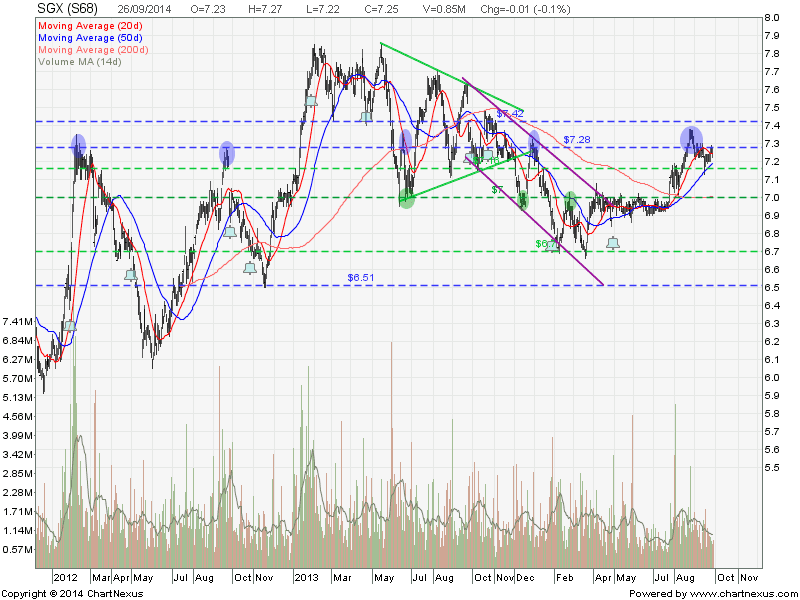
SGX has started an uptrend after breakout from the $7.00 resistance. SGX is technically bullish as the stock price is trading above the 20D/50D/200D Simple Moving Averages, whereby 20D/50D are trending up. However, it is important to take note that $7.28-$7.30 is a strong resistance zoom out the 3 years chart.

50D SMA serves at a neckline support of a Head and Shoulders. Trend may reverse if this 50D SMA support is broken.

Fundamentally SGX is over value base on PE, PEG and PB ratio.

Be cautious if you are going long at this level.

2014Sept27-SGX

Original Post by Marubozu My Stocks Investing Journey

Current P/E Ratio (ttm) 24.2232
Estimated P/E(06/2015) 22.3765
Relative P/E vs. FSSTI 1.7643
Earnings Per Share (SGD) (ttm) 0.2993
Est. EPS (SGD) (06/2015) 0.3240
Est. PEG Ratio 2.0435
Market Cap (M SGD) 7,764.87
Shares Outstanding (M) 1,071.02
30 Day Average Volume 1,196,667
Price/Book (mrq) 8.4123
Price/Sale (ttm) 11.3148
Dividend Indicated Gross Yield 3.86%
Cash Dividend (SGD) 0.1600
Dividend Ex-Date 10/01/2014
5 Year Dividend Growth -6.65%
Next Earnings Announcement 10/21/2014
Continue ReadingSGX: On Up Trend But….