Golden Agri: Finding Support?

  • Post author:

Golden Agri seems to find a support at about $0.50 and moving sideway for about 2 weeks. This level used to be a reliable Rectangle support. Keep a close eye if Golden Agri moves out of the down trend channel. This may be the 1st sign of trend reversal. There will be more downward pressure if this rectangle support is broken.

2014Sept27-Golden Agri-800x600

Original Post by Marubozu My Stocks Investing Journey

Current P/E Ratio (ttm) 18.0223
Estimated P/E(12/2014) 15.3967
Relative P/E vs. FSSTI 1.3126
Earnings Per Share (USD) (ttm) 0.0222
Est. EPS (USD) (12/2014) 0.0260
Est. PEG Ratio 1.2777
Market Cap (M SGD) 6,547.15
Shares Outstanding (M) 12,837.55
30 Day Average Volume 25,570,330
Price/Book (mrq) 0.5840
Price/Sale (ttm) 0.6917
Dividend Indicated Gross Yield 2.16%
Cash Dividend (SGD) 0.0052
Dividend Ex-Date 04/29/2014
5 Year Dividend Growth
Next Earnings Announcement 11/12/2014
Continue ReadingGolden Agri: Finding Support?

Sembcorp Marine: Official Down Trend

  • Post author:

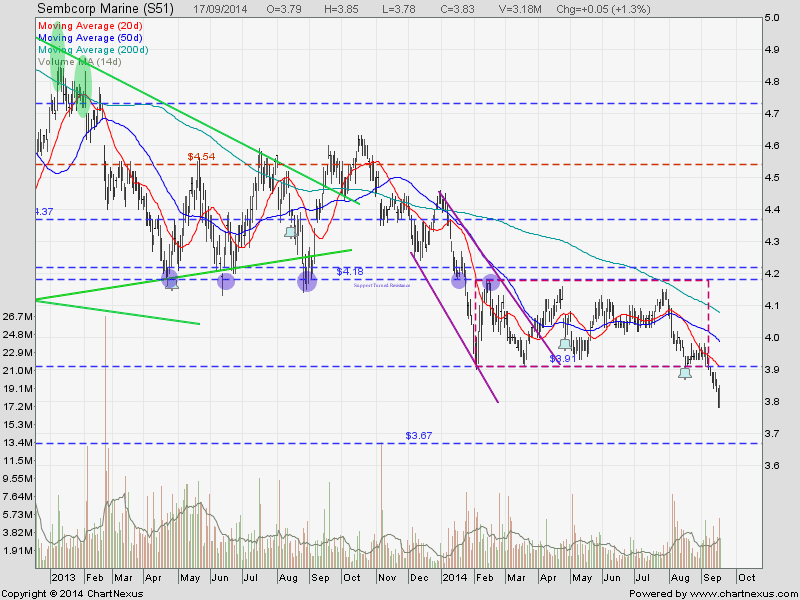
Sembcorp Marine is officially on Down Trend (Lower High, Lower Low has been formed) after breaking down of a Rectangle pattern and trade below all the 3 moving averages. Price target for this breakdown is $3.67. Currently Sembcorp Marine may rebound to test $3.91 to see whether this level can become a support turned resistance level.

2014Sept17-SembMar-800x600

Original Post by Marubozu My Stocks Investing Journey

Current P/E Ratio (ttm) 14.1276
Estimated P/E(12/2014) 13.6786
Relative P/E vs. FSSTI 1.0338
Earnings Per Share (SGD) (ttm) 0.2711
Est. EPS (SGD) (12/2014) 0.2800
Est. PEG Ratio 1.2724
Market Cap (M SGD) 8,001.89
Shares Outstanding (M) 2,089.27
30 Day Average Volume 3,084,967
Price/Book (mrq) 2.8945
Price/Sale (ttm) 1.3272
Dividend Indicated Gross Yield 2.87%
Cash Dividend (SGD) 0.0500
Dividend Ex-Date 08/15/2014
5 Year Dividend Growth 3.40%
Next Earnings Announcement 11/05/2014
Continue ReadingSembcorp Marine: Official Down Trend

Capitaland: Up Trend Ended

  • Post author:

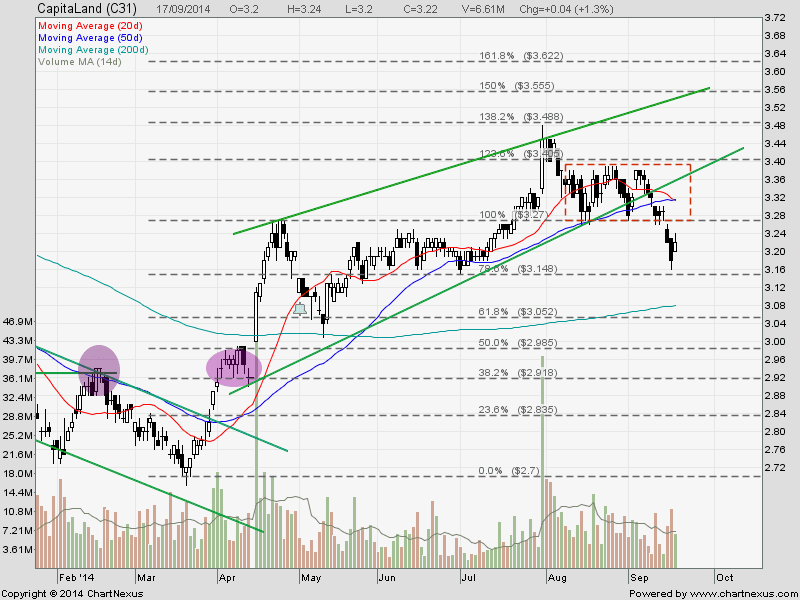
Capitaland up trend has ended after breaking the Rising Wedge support and breakout from Rectangle pattern. Currently Capitaland may rebound after forming Bullish Harami candlesticks. It is important to see whether $3.27 becomes a Support Turned Resistance level. Also take note that 50D SMA used to be a reliable support or resistance for Capitaland base on historical pattern.

Previous stock chart analysis of Capitaland can be found here.

2014Sept17-Capitaland-800x600

Continue ReadingCapitaland: Up Trend Ended