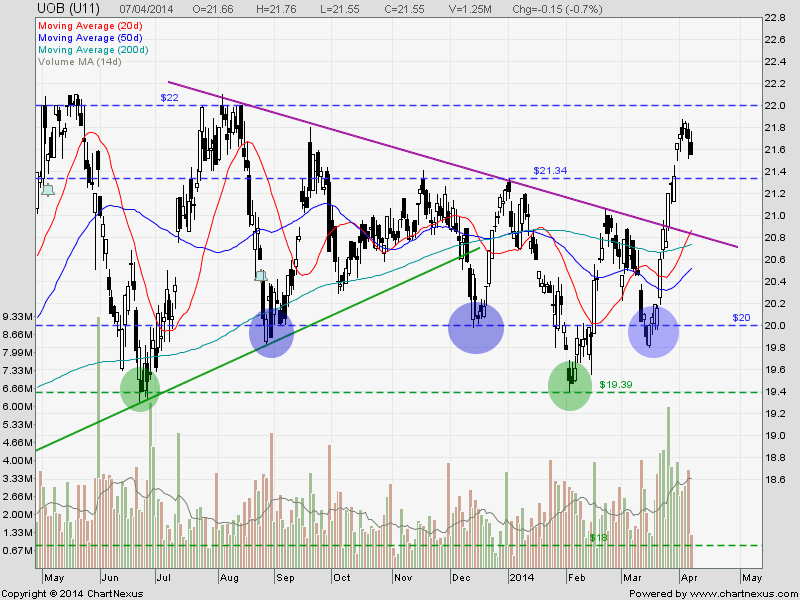
UOB has been on the strong run up since end of Mar due to window dressing. As UOB is getting near to the $22 resistance, the selling starts to appear. Base on the chart pattern, UOB is starting the trend reversal after showing a Hanging Man with a bearish candle as confirmation. Immediate support at $21.34 followed by $20.80 (200D SMA support and previous declining trend line resistance).
Original Post by Marubozu @ My Stocks Investing Journey.
| Current P/E Ratio (ttm) |
11.6955 |
| Estimated P/E(12/2014) |
11.5488 |
| Relative P/E vs. FSSTI |
0.8360 |
| Earnings Per Share (SGD) (ttm) |
1.8426 |
| Est. EPS (SGD) (12/2014) |
1.8660 |
| Est. PEG Ratio |
2.1927 |
| Market Cap (M SGD) |
33,975.15 |
| Shares Outstanding (M) |
1,576.57 |
| 30 Day Average Volume |
2,685,567 |
| Price/Book (mrq) |
1.4032 |
| Price/Sale (ttm) |
3.8652 |
| Dividend Indicated Gross Yield |
3.25% |
| Cash Dividend (SGD) |
0.5000 |
| Dividend Ex-Date |
04/29/2014 |
| 5 Year Dividend Growth |
1.49% |
| Next Earnings Announcement |
04/30/2014 |