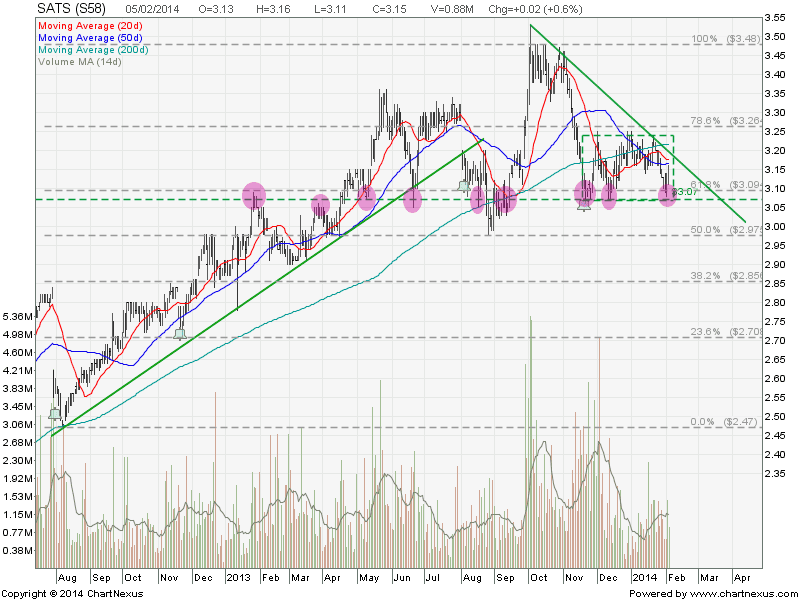
SIA Engineering : Start Down Trend!
SIA Engineering broke down from a Symmetrical Triangle and start a down trend now. The stock has a breakaway gap and currently trading below all 3 moving averages. Price Target for this breakout is $4.43. Immediate support turned resistance at $4.75 followed by $4.87 (Gap resistance & 61.8% FR).
Original post by Marubozu from My Stocks Investing Journey.

..
| Current P/E Ratio (ttm) | 19.5833 |
|---|---|
| Estimated P/E(03/2014) | 19.2623 |
| Relative P/E vs. FSSTI | 1.5459 |
| Earnings Per Share (SGD) (ttm) | 0.2400 |
| Est. EPS (SGD) (03/2014) | 0.2440 |
| Est. PEG Ratio | 3.6830 |
| Market Cap (M SGD) | 5,240.09 |
| Shares Outstanding (M) | 1,114.91 |
| 30 Day Average Volume | 210,633 |
| Price/Book (mrq) | 4.0539 |
| Price/Sale (ttm) | 4.5345 |
| Dividend Indicated Gross Yield | 4.68% |
| Cash Dividend (SGD) | 0.0700 |
| Dividend Ex-Date | 11/18/2013 |
| 5 Year Dividend Growth | 0.93% |
| Next Earnings Announcement | 05/14/2014 |
..
VALUATION RATIOS
| Company | Industry | Sector | |
|---|---|---|---|
| P/E Ratio (TTM) | 20.01 | 19.55 | 1,069.42 |
| P/E High – Last 5 Yrs. | 19.50 | 104.50 | 43.62 |
| P/E Low – Last 5 Yrs. | 7.77 | 30.55 | 10.65 |