
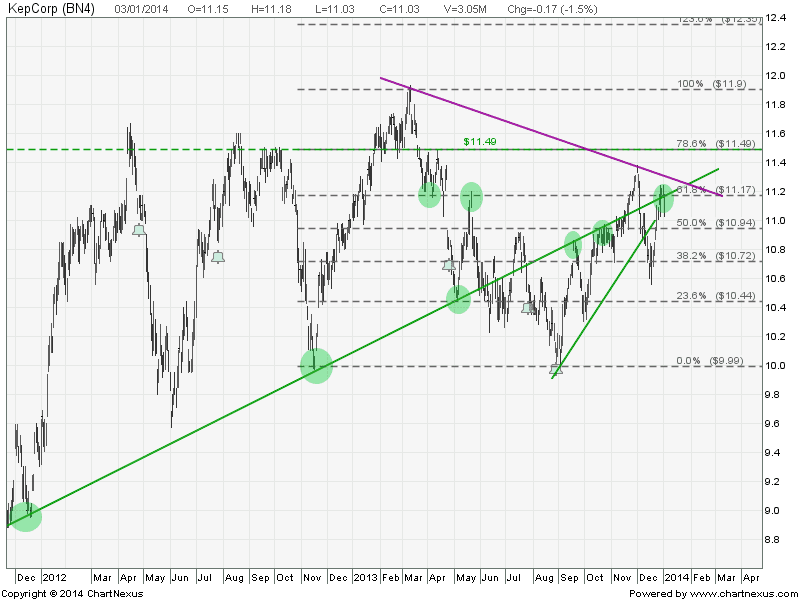
KepCorp: Short Term Bearish
KepCorp rejected at the support turned resistance (uptrend line started from Dec 2011 & horizontal line at about 61.8% FR level) with a bearish closing Marubozu candle after Bearish Engulfing candles. KepCorp may be forming a Head and Shoulder pattern and reverse to a bearish trend.
Critical Support at $10.94 (50% FR & previous resistance turned support).
Critical Resistance at about $11.17-$11.22.
Original post by Marubozu @ My Stocks Investing Journey.
| Current P/E Ratio (ttm) | 11.1640 |
|---|---|
| Estimated P/E(12/2013) | 13.1310 |
| Relative P/E vs. FSSTI | 0.8368 |
| Earnings Per Share (SGD) (ttm) | 0.9880 |
| Est. EPS (SGD) (12/2013) | 0.8400 |
| Est. PEG Ratio | – |
| Market Cap (M SGD) | 19,941.65 |
| Shares Outstanding (M) | 1,807.95 |
| 30 Day Average Volume | 3,092,467 |
| Price/Book (mrq) | 2.2132 |
| Price/Sale (ttm) | 1.6876 |
| Dividend Indicated Gross Yield | 3.35% |
| Cash Dividend (SGD) | 0.1000 |
| Dividend Ex-Date | 07/25/2013 |
| 5 Year Dividend Growth | -10.02% |
| Next Earnings Announcement | 01/24/2014 |

