
Raffles Education – What an interesting trading lesson today!
I have been waiting for opportunity to sell off my Raffles Education (PE ratio = 28) shares because I don’t feel comfortable holding this stock entering the historically most bearish month of the year. In addition, the stock price has been testing the $0.52 200D MA support line for a few days. Any breakdown of the support will start the down trend. Thus, I take a “Not to lose money” approach and wait for the price to go up to $0.525 (my entry point) to exit the position.

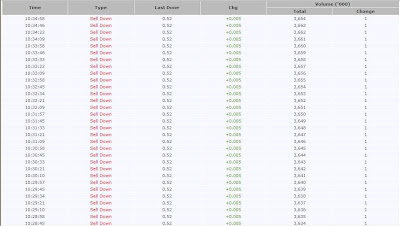
Coincidently I have a chance to catch an interesting trading session by some professional traders out there. I have been puzzled by why there are so many 1 lot selling out there every second and every minute for quite sometimes. I copied some transactions to illustrate my observations and tried to establish my own hypothesis. First of all, I don’t believe there are so many retail investors doing one lot transaction because the stock price has to move up by 5% to breakeven (to pay for the transaction commission). I was thinking that professional traders might try to test the support between $0.515 and $0.52 (200D MA at $0.52) before entering a big position by end of the day. I observed the trade every now and then to prove whether my hypothesis was right because this phenomenon was something very new and strange to me. From the early morning trade, there were one or two lots sold at $0.515. As soon as someone bought at $0.52 (50, 11, 10, 5), the stock price dropped back to $0.515 immediately (by 1 lot). Refer to Screen 1. Screen 2 showed all 1 lot transaction at $0.52 (about 10:30am) to check whether anyone was queuing at this price.
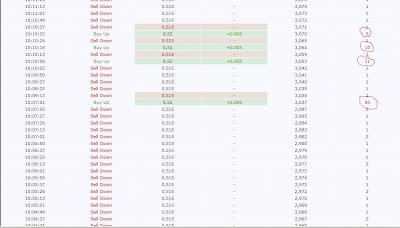


Screen 1

Screen 2
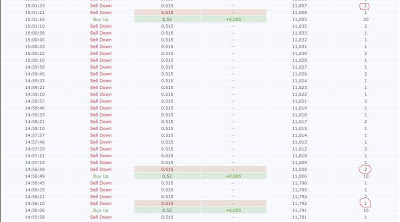
At about 3pm, the testing was between $0.515 and $0.52. The price went back immediately to $0.515 by 1 lot. Refer to Screen 3.

Screen 3
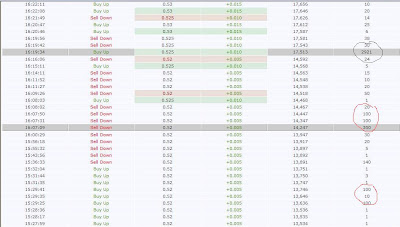
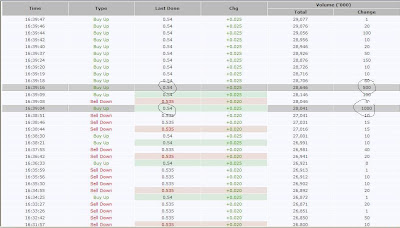
15 minutes later, the price moved up to $0.52 and I can see some genuine retail investors were buying up (100, 26, 92) and suddenly a 500 lots transaction shown up! Refer to Screen 4.

Screen 4
At this point, it looks like the support line between $0.515 and $0.52 is very strong and unlikely the stock price will breakdown to start the down trend. The BIG FISH finally appeared bought 2921 lots at $0.525. Refer to Screen 5. My stocks were already sold by the time I realised the stock price was moving up.

Screen 5
From this point onwards between 4:20pm and before the market closed, all the small fishes, medium fishes, big fishes were rushing in to close the price at $0.54 with one long white candle! Refer to Screen 6 & 7.

Screen 6

Screen 7
Although I lost an opportunity to sell at $0.54 but this interesting trade was an eye opener to me. It looks like my hypothesis was right and hopefully I can make full use of this lesson for future trade. I am going to check with my trainer tomorrow!

