SATS: Watch the Crucial Support

  • Post author:

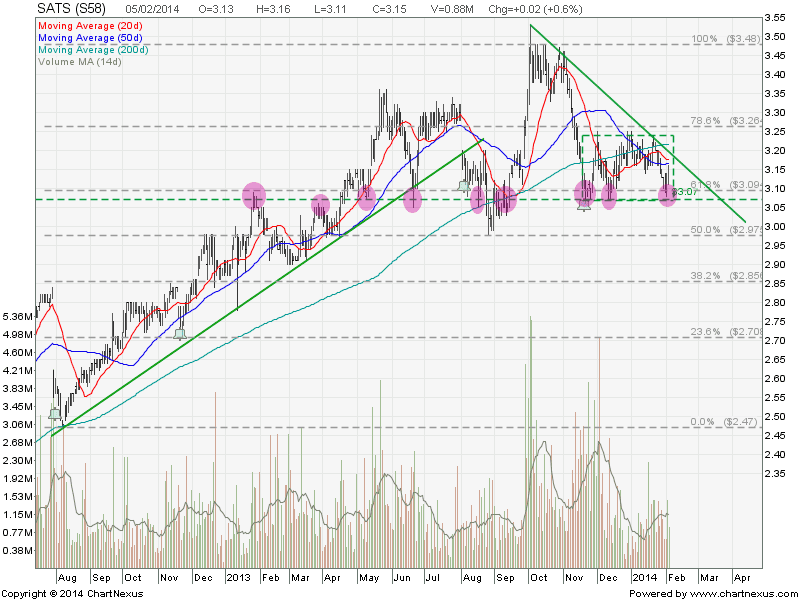
SATS  is holding well during the January 2014 worldwide sell off. The key question is: How Long can SATS continue to hold and avoid being sold off?

Base on the chart, SATS is currently trading in a Rectangle and also the Descending Triangle with a crucial resistance turned support zone between $3.07 and $3.10. This support zone coincides with the 61.8% Fibonacci Retracement Level. Upside is very limited as there are many resistances (20D, 50D, 200D SMA), Rectangles resistance and the Descending Triangle resistance from $3.16 to $3.24.

2014Feb5-SATS-800x600

Original post by Marubozu from My Stocks Investing Journey.

Fundamental Data for SATS

Current P/E Ratio (ttm) 18.7500
Estimated P/E(03/2014) 16.7553
Relative P/E vs. FSSTI 1.4917
Earnings Per Share (SGD) (ttm) 0.1680
Est. EPS (SGD) (03/2014) 0.1880
Est. PEG Ratio 1.7656
Market Cap (M SGD) 3,532.90
Shares Outstanding (M) 1,121.56
30 Day Average Volume 916,733
Price/Book (mrq) 2.5450
Price/Sale (ttm) 1.9475
Dividend Indicated Gross Yield 3.49%
Cash Dividend (SGD) 0.0500
Dividend Ex-Date 11/19/2013
5 Year Dividend Growth 1.39%
Next Earnings Announcement 02/11/2014

..

VALUATION RATIOS

Company Industry Sector
P/E Ratio (TTM) 17.31 19.48 1,065.88
P/E High – Last 5 Yrs. 16.87 104.42 43.28
P/E Low – Last 5 Yrs. 8.90 30.42 10.59


Summary

Fundamentally SATS is not cheap base on PE Ratio as current PE (TTM) is at the high end of PE High for the last 5 years. Dividend yield at 3.49% is not very attractive as there are other blue chip stocks or REIT with more attractive dividend yield.

Technically SATS upside is capped by the down trend line and there is a danger of breaking the crucial support. It is expected more selling to come if the support is broken. Good candidate to short with price target of $2.90 (Rectangle) and $2.70 (Descending Triangle).

Continue ReadingSATS: Watch the Crucial Support

Strongest Mid Cap Dividend yields over the past year

  • Post author:

Over the course of 2012 the FTSE ST Mid Cap Index has maintained a higher dividend yield than the Straits Times Index (STI), the broader FTSE ST All Share Index, in addition to the regional FTSE Asia Pacific All Cap Index.
 
In fact, looking back over the past 12 months the FTSE ST Mid Cap Index appreciated +22.4% in price, while providing a total return of +29.4% in Singapore Dollar terms. The approximate +7.0% difference, sourced by Bloomberg, represents reinvested dividend distributions that are weighed according to the weighting of the relevant stock within the Index. In the most recent monthly reports FTSE Group had estimated the difference between price appreciation and total return of the Mid Cap Index to be +6.2% in the 12 months ending 31 October.
 
Dividend yields for the stocks of the Mid Cap Index that distribute dividends varied from  +0.1% for Ezion Holdings [5ME] to +16.9% for STX OSV Holdings [MS7] over the 12 months ending 23 November. A recent and full list of the 12 month dividend history of the constituents can be found here
 
The five Mid Cap stocks with the strongest dividend distributions over the 12 months ending 23 November, were as follows:

  1. STX OSV Holdings paid 16.9% in dividends which included a special cash dividend in August. The yield contributed to a 12 month total return of +41.2%. Current indicative yield is 7.4%.
  2. SATS Ltd [S58] paid 9.5% in dividends (also included a special dividend) boosting 12 month total return to +34.5%. Current indicative yield is 4.0%.
  3. Hutchison Port Holdings Trust [NS8U] paid a dividend yield of 8.2%, boosting 12 month total return to +35.2%. The current indicative yield of the Trust is 8.2%.
  4. CapitaRetail China Trust [AU8U] distributed 8.1% in dividends, boosting 12 month total return to +46.4%. The current indicative yield of the REIT is 6.3%.
  5. Pacific Andes Resources Development [P11] distributed 7.3% in dividends, contributing to a total return of -16.6% over the 12 months. Current indicative yield is 7.3%.

 
Of the 50 constituent stocks of the Index, the simple average dividend yield for the past 12 months was around 4.3%. A handful of stocks did not distribute dividends. Furthermore, the simple average of 4.3% does not take into account the different impact of dividend distributions on the Index because of the relevant stock’s weighting in the Index. For instance, consider the dividend yields of Hutchison Port Holdings Trust at 8.2% and Yangzijiang Shipping Holdings [BS6] at 6.1% over the past 12 months. As of the end of October, FTSE Group maintained that Hutchison Port Holdings Trust accounted for an 8.5% weighting in the Mid Cap Index versus a 2.8% weighting for Yangzijiang Shipping Holdings. Thus, the dividend yield of Hutchison Port Holdings Trust had more Index impact than Yangzijiang Shipping Holdings. Comparing the simple average yield to the actual weighted yield associated with the Index reveals that over the past 12 months the Index was more weighted to stocks with a dividend yield above 4.3%.


Source: SGX My Gateway


Continue ReadingStrongest Mid Cap Dividend yields over the past year