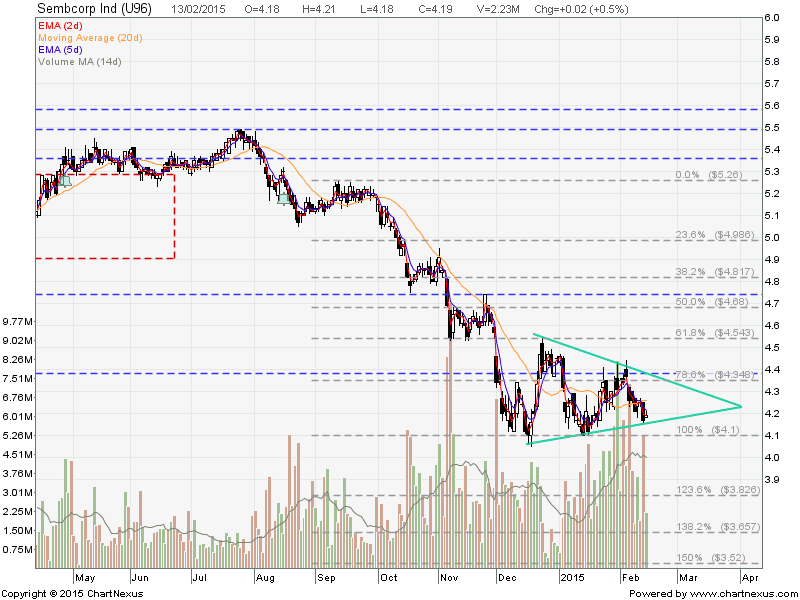
SembCorp Industry: Shooting Star at 20D SMA Resistance
SembCorp Industry was rejected at 20D SMA Resistance with Shooting Star candlestick pattern.
20D SMA is a reliable resistance on this down trend. Wait for confirmation to short.


SembCorp Industry was rejected at 20D SMA Resistance with Shooting Star candlestick pattern.
20D SMA is a reliable resistance on this down trend. Wait for confirmation to short.
SembCorp has been a solid bull run for the past 2 weeks after breakout from a Rectangle with increase of volume. Watch out for pull back as SembCorp is overbought and reaching the 200D SMA resistance & previous support turned resistance at about $4.75. A Shooting Star candlestick was formed at the resistance also. $4.5 is a good entry level for bullish trade if this support holds. Take note on the Dividend XD Date on April 23 and Quarterly earning announcement on May 7.

Original post by Marubozu My Stocks Investing Journey.
| Current P/E Ratio (ttm) | 10.7876 |
|---|---|
| Estimated P/E(12/2015) | 10.6935 |
| Relative P/E vs. FSSTI | 0.7580 |
| Earnings Per Share (SGD) (ttm) | 0.4431 |
| Est. EPS (SGD) (12/2015) | 0.4470 |
| Est. PEG Ratio | – |
| Market Cap (M SGD) | 8,527.28 |
| Shares Outstanding (M) | 1,783.95 |
| 30 Day Average Volume | 3,006,113 |
| Price/Book (mrq) | 1.5754 |
| Price/Sale (ttm) | 0.7837 |
| Dividend Indicated Gross Yield | 4.60% |
| Cash Dividend (SGD) | 0.1100 |
| Dividend Ex-Date | 04/23/2015 |
| 5 Year Dividend Growth | 14.87% |
| Next Earnings Announcement | 05/07/2015 |
SembCorp is currently consolidating in a Symmetrical Triangle and still on the down trend.
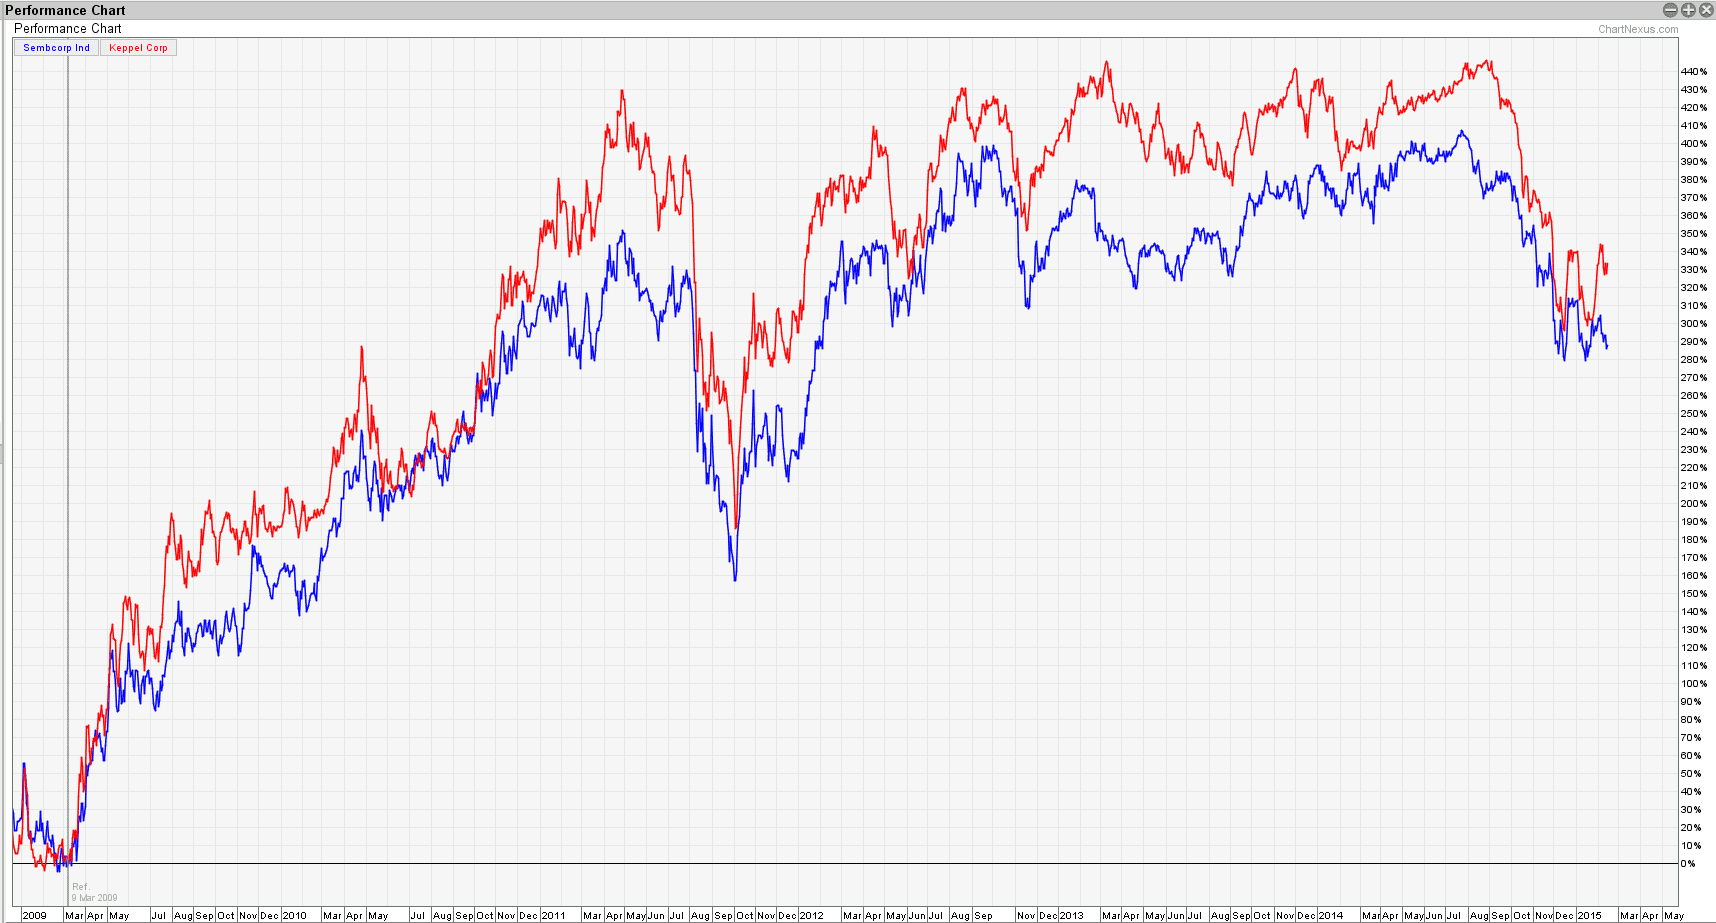
Potential Hedging Pair trade with KepCorp which has shown a trend reversal pattern of Double Bottoms. Long KepCorp and Short SembCorp.
| Current P/E Ratio (ttm) | 9.6611 |
|---|---|
| Estimated P/E(12/2014) | 9.6767 |
| Relative P/E vs. FSSTI | 0.6989 |
| Earnings Per Share (SGD) (ttm) | 0.4337 |
| Est. EPS (SGD) (12/2014) | 0.4330 |
| Est. PEG Ratio | 1.4443 |
| Market Cap (M SGD) | 7,475.11 |
| Shares Outstanding (M) | 1,784.04 |
| 30 Day Average Volume | 3,735,873 |
| Price/Book (mrq) | 1.4408 |
| Price/Sale (ttm) | 0.6679 |
| Dividend Indicated Gross Yield | 1.19% |
| Cash Dividend (SGD) | 0.0500 |
| Dividend Ex-Date | 08/15/2014 |
| 5 Year Dividend Growth | 14.87% |
| Next Earnings Announcement | 02/17/2015 |