Singapore Exchange (SGX): Testing 200D SMA Support

  • Post author:

Singapore Exchange (SGX) has dropped about 11% since the May 2015 high of $8.80. Base on current chart pattern, SGX has broken the uptrend support and currently testing 200D SMA support at about $7.75.  Current uptrend support has now turned to resistance. Keep a close eye on the current support level ($7.84 and $7.75) to see whether there is a change in trend for SGX. It is good opportunity to short sell SGX if these supports are broken because SGX will enter into bearish territory and starts down trend.

2015June16-SGX

Original post from My Stocks Investing Journey.

Continue ReadingSingapore Exchange (SGX): Testing 200D SMA Support

SGX: On Up Trend But….

  • Post author:

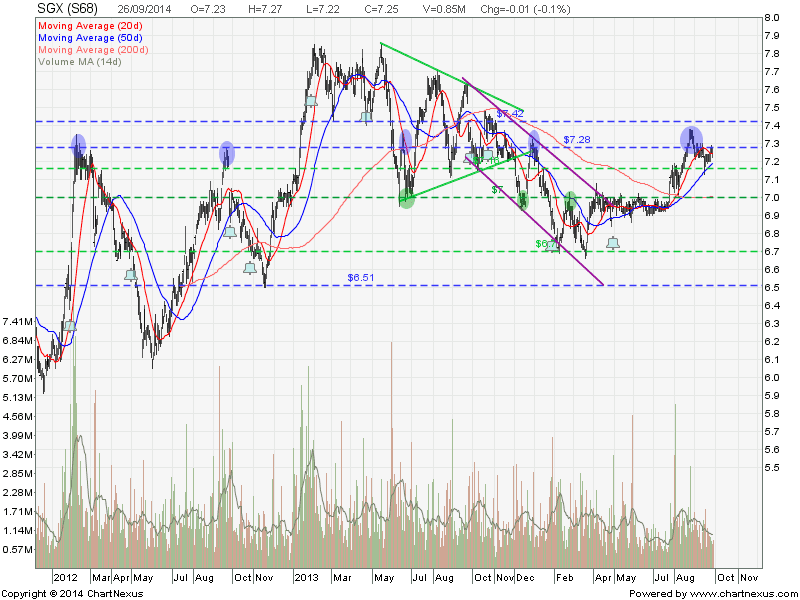
SGX has started an uptrend after breakout from the $7.00 resistance. SGX is technically bullish as the stock price is trading above the 20D/50D/200D Simple Moving Averages, whereby 20D/50D are trending up. However, it is important to take note that $7.28-$7.30 is a strong resistance zoom out the 3 years chart.

50D SMA serves at a neckline support of a Head and Shoulders. Trend may reverse if this 50D SMA support is broken.

Fundamentally SGX is over value base on PE, PEG and PB ratio.

Be cautious if you are going long at this level.

2014Sept27-SGX

Original Post by Marubozu My Stocks Investing Journey

Current P/E Ratio (ttm) 24.2232
Estimated P/E(06/2015) 22.3765
Relative P/E vs. FSSTI 1.7643
Earnings Per Share (SGD) (ttm) 0.2993
Est. EPS (SGD) (06/2015) 0.3240
Est. PEG Ratio 2.0435
Market Cap (M SGD) 7,764.87
Shares Outstanding (M) 1,071.02
30 Day Average Volume 1,196,667
Price/Book (mrq) 8.4123
Price/Sale (ttm) 11.3148
Dividend Indicated Gross Yield 3.86%
Cash Dividend (SGD) 0.1600
Dividend Ex-Date 10/01/2014
5 Year Dividend Growth -6.65%
Next Earnings Announcement 10/21/2014
Continue ReadingSGX: On Up Trend But….

SGX: Facing Tough Resistance

  • Post author:

SGX is currently facing a very tough resistance at $7.00 (Round Number Psychological Resistance). This $7.00 is also the support turned resistance & down trend channel resistance. SGX probably will trade within a Rectangle and range bound between $6.70 & $7.00 unless SGX is able to break and stay above $7.00.

2014April16-SGX

Original Post by Marubozu @ My Stocks Investing Journey.

Current P/E Ratio (ttm) 21.0255
Estimated P/E(06/2014) 21.5888
Relative P/E vs. FSSTI 1.4858
Earnings Per Share (SGD) (ttm) 0.3296
Est. EPS (SGD) (06/2014) 0.3210
Est. PEG Ratio 2.0367
Market Cap (M SGD) 7,414.41
Shares Outstanding (M) 1,069.90
30 Day Average Volume 1,509,200
Price/Book (mrq) 9.1996
Price/Sale (ttm) 10.0331
Dividend Indicated Gross Yield 4.04%
Cash Dividend (SGD) 0.0400
Dividend Ex-Date 01/28/2014
5 Year Dividend Growth -6.41%
Next Earnings Announcement 04/23/2014
Continue ReadingSGX: Facing Tough Resistance