SingTel: Capped by Declining Trend Line

  • Post author:

Expect more down side for SingTel as the stock is currently capped by the Declining Trend Line Resistance. A short selling position has higher probability of winning. Favorable Reward Risk Ratio with target price of $3.43 which is a very strong support tested past 5 occasions.

We cannot ignore the short selling trading skill in this bear market because short selling is required to either Hedge our current investment portfolio which we don’t intend to sell because of the dividend payout, or profit from the short term price weakness. Learn how to Hedge your Dividend Stocks Portfolio or Profit from Short Selling Singapore Stocks here.

SingTel Feb22-2016

Continue ReadingSingTel: Capped by Declining Trend Line

Singapore Telecom (SingTel): Break Neckline of Head and Shoulders Pattern

  • Post author:

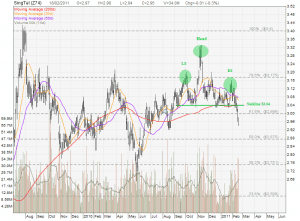
Singapore Telecom (SingTel) broke the Neckline of a complicated Head and Shoulders Pattern at $3.04. The price target of this breakdown is at least $2.875 or below. Take note that SingTel has started the down trend as the stock is currently trading below 20D, 50D and 200D MA. Singtel has also broken the 61.8% Fibonacci Support at about $3.00. Bear is clearly in charge in this SingTel stock chart for the time being.

Continue ReadingSingapore Telecom (SingTel): Break Neckline of Head and Shoulders Pattern

Comparison of Singapore Telco Companies Stocks

  • Post author:

PE ratio and Dividend Yield comparison for SingTel, StarHub and M1.

SingTel Chart

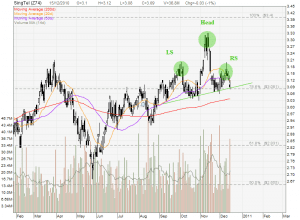
Head and Shoulders formation for SingTel stock chart, currently SingTel is testing the neckline at about $3.08 which is also a  78.6% Fibonacci Support Level. Breaking down this neckline with huge volume with confirm the pattern and may send SingTel to the price target of $2.83.

StarHub Chart

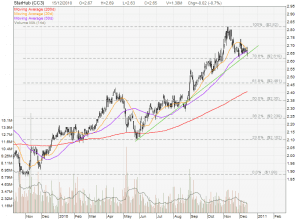
StarHub is currently testing the uptrend support at around $2.62 (also 50D MA support) to $2.65 (78.6% Fibonacci Support). Breaking these support levels indicate the end of up trend.

M1 Chart

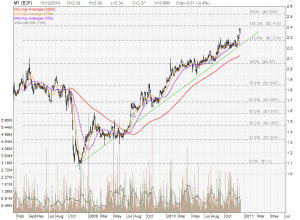
M1 is trading at  5 years high. Although the chart still shows the uptrend but M1 is closing to the next 138.2% Fibonacci Resistance at about $2.413. Uptrend support is at about $2.274.

In summary

Upside potential (for capital gain) are limited  for SingTel, StarHub and M1 base on PE ratio comparison and chart patterns. Dividend yields are still attractive at current stock price.

Continue ReadingComparison of Singapore Telco Companies Stocks