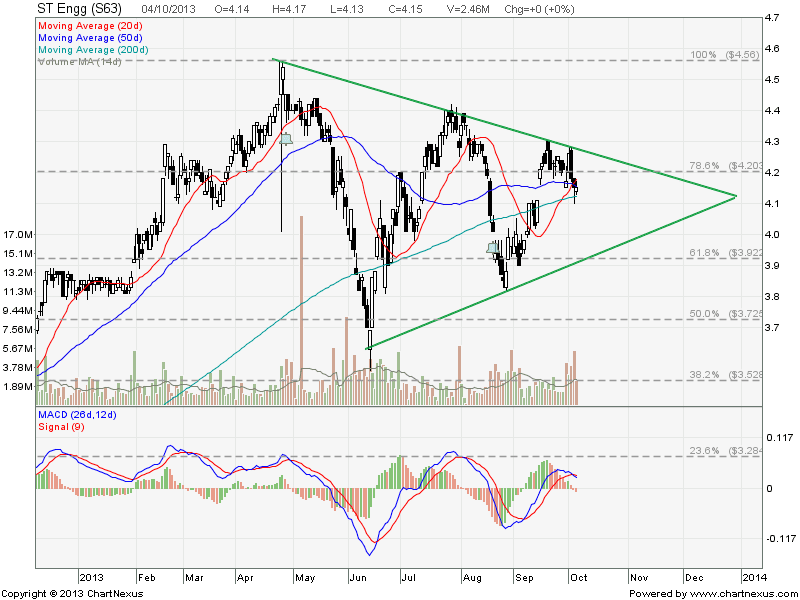
ST Engineering: Consolidation in Symmetrical Triangle
ST Engineering is currently consolidating in a Symmetrical Triangle.
Previous analysis on ST Engineering.

ST Engineering is currently consolidating in a Symmetrical Triangle.
Previous analysis on ST Engineering.
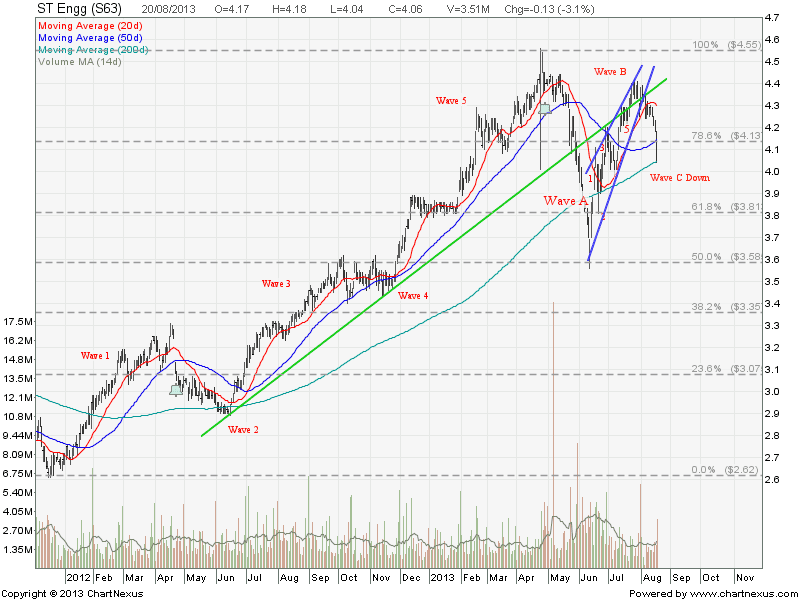
It is coming! Elliott Wave C down!
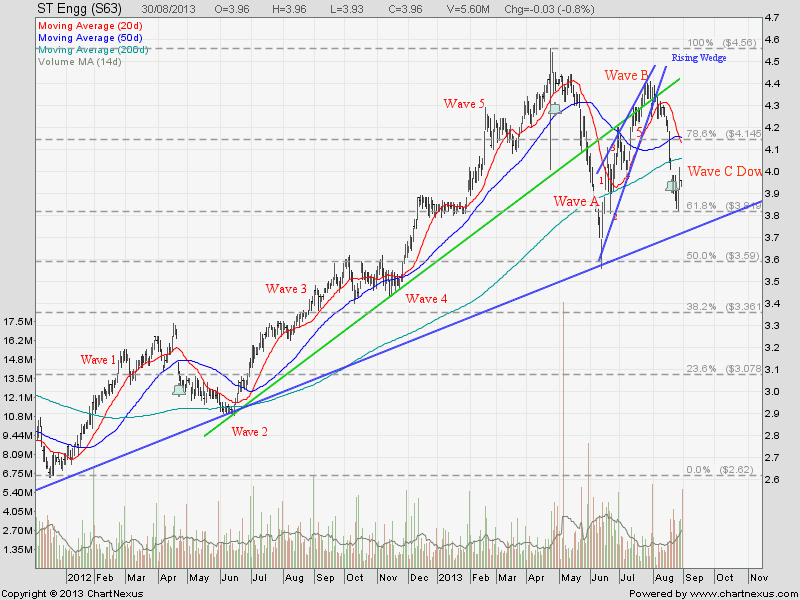
See previous post of ST Engineering – Elliott Wave C Down.
You are going to miss big time if you still do not know how to short (Sell High, Buy Low) Singapore stocks using CFD.
Want to find out more about CFD trading, click here to contact Rebecca Goh to ask for demo.
ST Engineering broke down from the Rising Wedge and is currently testing 200D SMA. If this 200D SMA support is broken, there will be a huge down side to go base on Elliott Wave pattern (Wave C Down). Sit tight!
See last analysis on ST Engineering.
| Current P/E Ratio (ttm) | 21.5728 |
|---|---|
| Estimated P/E(12/2013) | 20.1990 |
| Relative P/E vs. FSSTI | 1.6640 |
| Earnings Per Share (SGD) (ttm) | 0.1882 |
| Est. EPS (SGD) (12/2013) | 0.2010 |
| Est. PEG Ratio | 2.4336 |
| Market Cap (M SGD) | 12,606.04 |
| Shares Outstanding (M) | 3,104.94 |
| 30 Day Average Volume | 1,646,100 |
| Price/Book (mrq) | 6.8085 |
| Price/Sale (ttm) | 1.9539 |
| Dividend Indicated Gross Yield | 1.72% |
| Cash Dividend (SGD) | 0.0300 |
| Last Dividend | 08/21/2013 |
| 5 Year Dividend Growth | -0.09% |
| Next Earnings Announcement | 11/07/2013 |