UOB Bank: Rejected at $20 Resistance

  • Post author:

UOB rejected at $20.00 resistance with Bearish Engulfing pattern with a spike in trading volume. Is it a first sign of trend reversal? Anyway, I have shorted the stock using CFD base on my trading strategy “Buy Near Support, Sell Near Resistance” when I see a reversal candlestick pattern with a very tight stop loss just slightly above $20.00 resistance. All other technical indicators have not shown any bearish signals yet.

On a bigger scale, UOB is showing a Huge Ascending Triangle with a tough pyschological resistance at $20.00. 200D SMA support is at about $19.15.

Previous analysis on UOB Bank.

2013Mar23-UOB-800x600

Key Statistics for UOB

Current P/E Ratio (ttm) 11.5109
Estimated P/E(12/2013) 11.6775
Relative P/E vs. FSSTI 1.0717
Earnings Per Share (SGD) (ttm) 1.7175
Est. EPS (SGD) (12/2013) 1.6930
Est. PEG Ratio 1.3011
Market Cap (M SGD) 31,134.76
Shares Outstanding (M) 1,574.85
30 Day Average Volume 2,327,567
Price/Book (mrq) 1.3577
Price/Sale (ttm) 3.6342
Dividend Indicated Gross Yield 3.03%
Cash Dividend (SGD) 0.1000
Last Dividend 05/06/2013
5 Year Dividend Growth -5.09%
Next Earnings Announcement 05/09/2013
Continue ReadingUOB Bank: Rejected at $20 Resistance

UOB Bank: Facing Very Tough Resistance

  • Post author:

UOB Bank is facing very tough resistance at $19.85. UOB was unable to break this resistance for past 9 occasions in 3 years. If UOB manages to break this level, the stock will face next important resistance of $20.00 (round number and psychological resistance) immediately. At current price, the downside risk is much higher than upside potential. UOB is showing a Hanging man at the resistance indicates potential reveral with uptrend support at about $19.20. Breaking this support will send UOB to $18.80 (200D SMA) followed by $18.12 (61.8% Fibonacci Retracement Level). I am waiting for the right moment to short the stock using CFD.

Key Statistics for UOB

Current P/E Ratio (ttm) 12.1782
Estimated P/E(12/2012) 11.9039
Relative P/E vs. FSSTI 1.0045
Earnings Per Share (SGD) (ttm) 1.6275
Est. EPS (SGD) (12/2012) 1.6650
Est. PEG Ratio 0.8785
Market Cap (M SGD) 31,211.52
Shares Outstanding (M) 1,574.75
30 Day Average Volume 2,226,200
Price/Book (mrq) 1.4117
Price/Sale (ttm) 3.7446
Dividend Indicated Gross Yield 3.03%
Cash Dividend (SGD) 0.2000
Last Dividend 08/30/2012
5 Year Dividend Growth -5.09%
Next Earnings Announcement 02/22/2013
Continue ReadingUOB Bank: Facing Very Tough Resistance

Singapore Banks average 15% total return over past year

  • Post author:

Source: SGX Gateway

Singapore Exchange (SGX) lists three locally incorporated banks, DBS Group (D05), OCBC (O39) and UOB (U11) which together make up a quarter of the Straits Times Index (STI) market capitalisation.  A key measure of a bank is its tier 1 capital to risk weighted asset ratio. Tier 1 capital represents the best form of capital and the higher the ratio to risk weighted assets, the more money the bank has to support the risks it takes.  Together, the Singapore banks maintain a Tier 1 capital ratio to risk weighted assets of 13.6%, as reported by the IMF Global Financial Stability Report last week.  
 
Singapore maintains the highest Tier 1 to risk weighted asset ratio across Asia, with Tier 1 capital for Japan Banks at 12.3% and Hong Kong Banks at 10.4%.  It is a key measure of the strength of a bank, which is why the annual Bloomberg global rankings place 40% of the scoring emphasis on it. These rankings placed OCBC at #1, UOB at #7 and DBS at #8 in 2012. The total return of the three banks over the past year averages to 15%with individual performances as follows:

  1. DBS Group Holdings (D05) accounts for 9.2% of the STI market capitalisation. The 2012 World’s Strongest Bank rankings from Bloomberg noted DBS maintained a 12.9% ratio of Tier 1 capital to risk weighted assets. DBS has generated a total return of 19.6% in the past year, compared to an average annualised total return of 8.1% over the ten year period ending September 2012. DBS currently maintains an indicative dividend yield of 3.95%.
     
  2. OCBC (O39) accounts for 8.5% of the STI market capitalisation. This 2012 World’s Strongest Bank rankings from Bloomberg noted OCBC maintained a 14.4% ratio of Tier 1 capital to risk weighted assets. OCBC has generated a total return of 14.4% in the past year. This compares to an average annualised total return of 14.2% over the ten year period ending September 2012. OCBC currently maintains an indicative dividend yield of 3.33%.
     
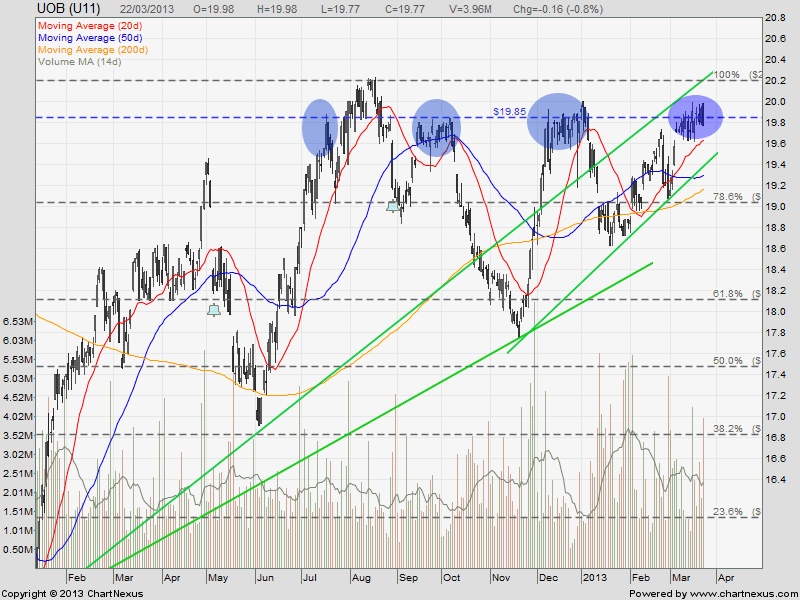
  3. United Overseas Bank (U11) accounts for 8.1% of the STI market capitalisation. This year’s World’s Strongest Bank ranking from Bloomberg noted UOB maintain a 13.5% ratio of Tier 1 capital to risk weighted assets. UOB has generated a total return of 11.2% in the past year, compared to an average annualised total return of 9.6% over the ten year period ending September 2012. UOB currently maintains an indicative dividend yield of 3.17%.
Continue ReadingSingapore Banks average 15% total return over past year