Russel 2000 ETF (IWM): Trend Reversal!

  • Post author:

Russel 2000 ETF (IWM) showed a Three Outside Down, reversal pattern, after getting near to the all time high level. Watch out for a start of down trend. 200D SMA support is at $114.

Current PE for Russell 2000 is 50.41 (over value).

Base on past IWM chart pattern, IWM has nice tradeable pattern in two directions (up trend and down trend).

IWM Dec1-2014

Original post from My Stocks Investing Journey by Marubozu.

Continue ReadingRussel 2000 ETF (IWM): Trend Reversal!

Stock Market in RED! Is It Time to Short the Fear?

  • Post author:

Original Post by Marubozu My Stocks Investing Journey

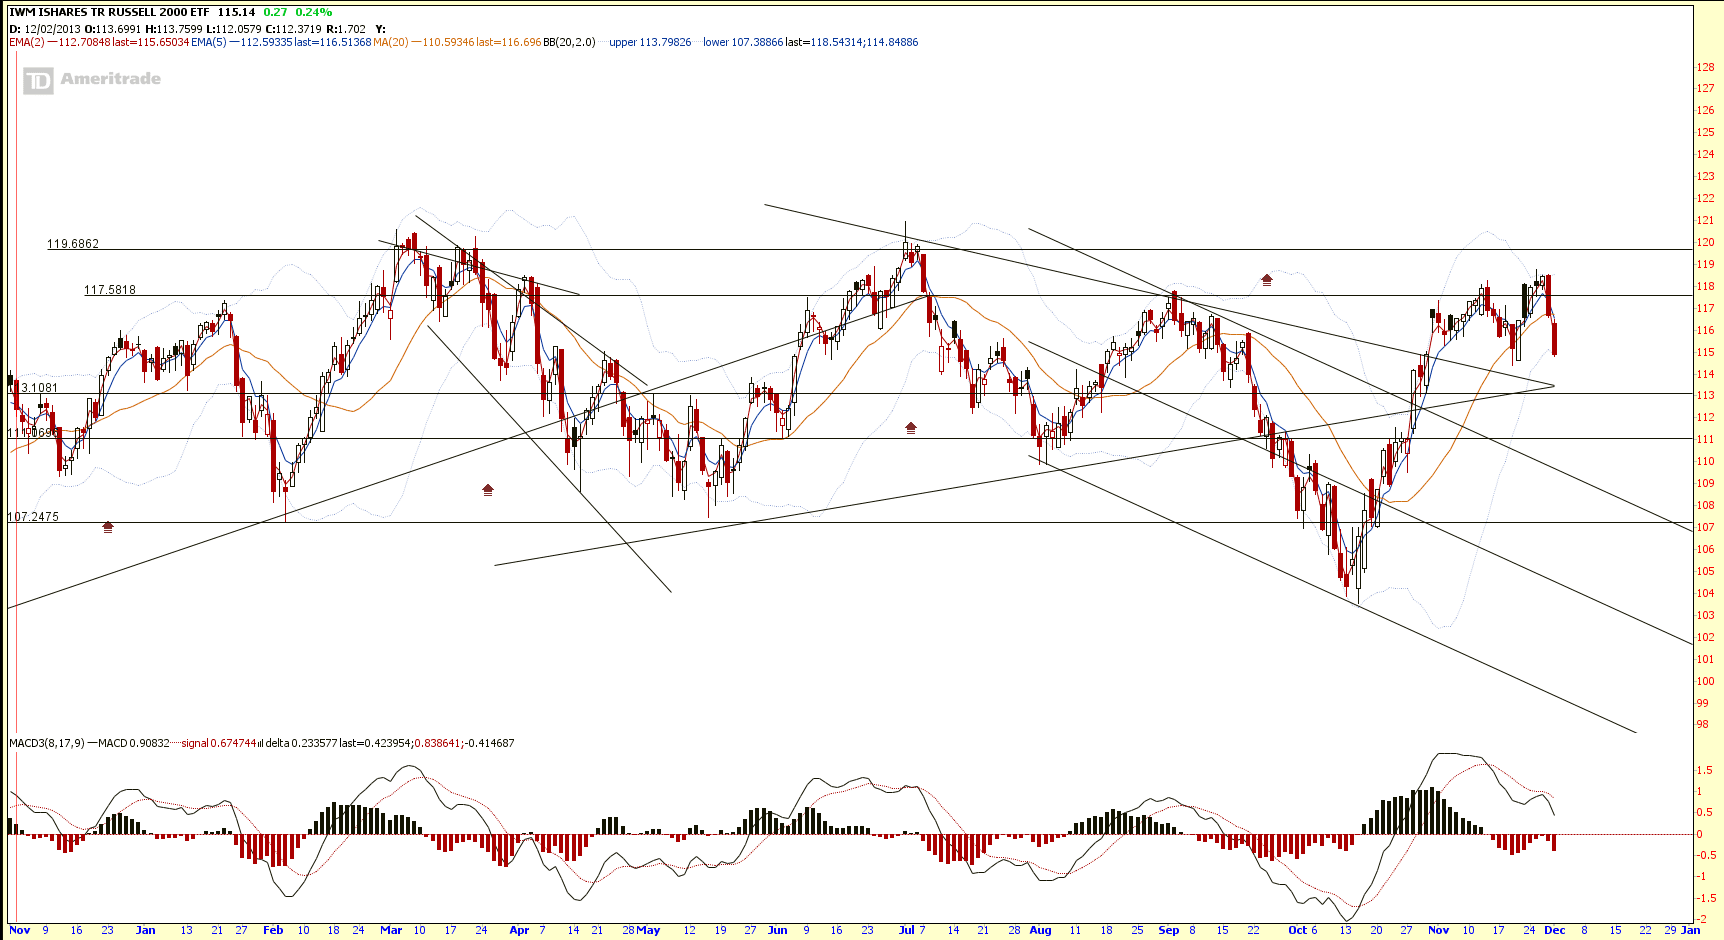
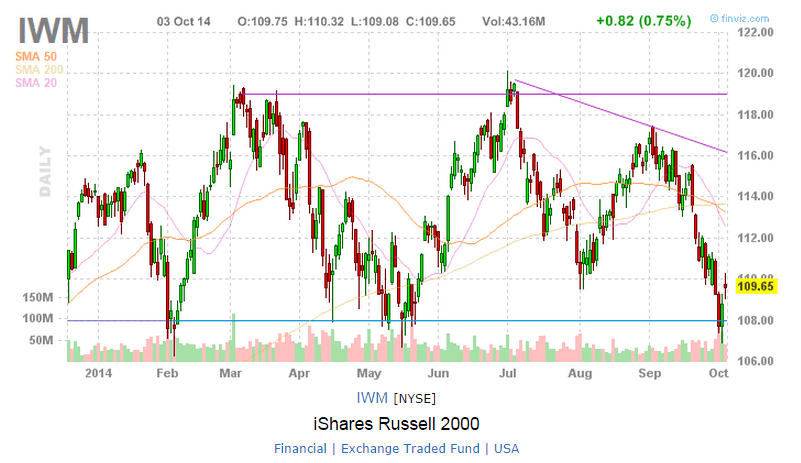
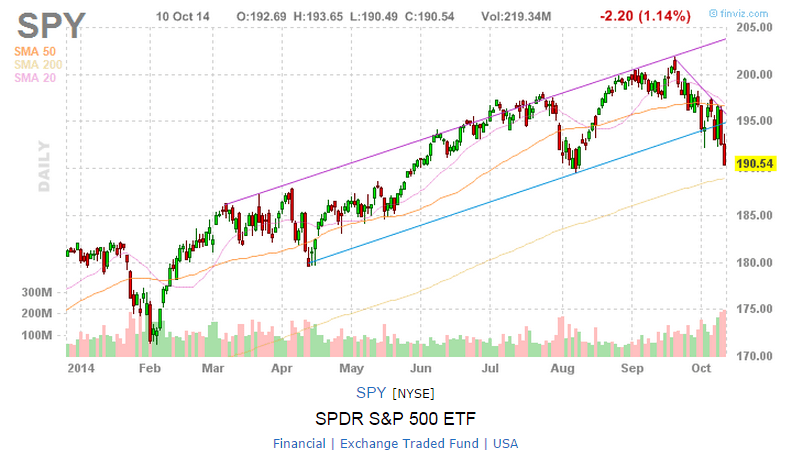
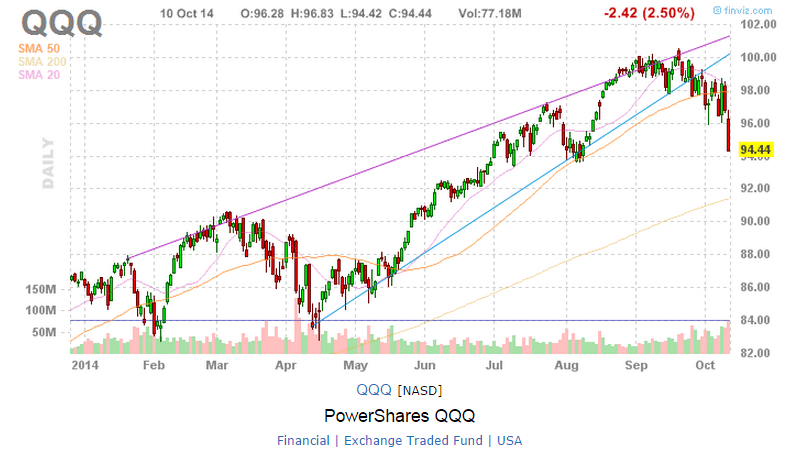
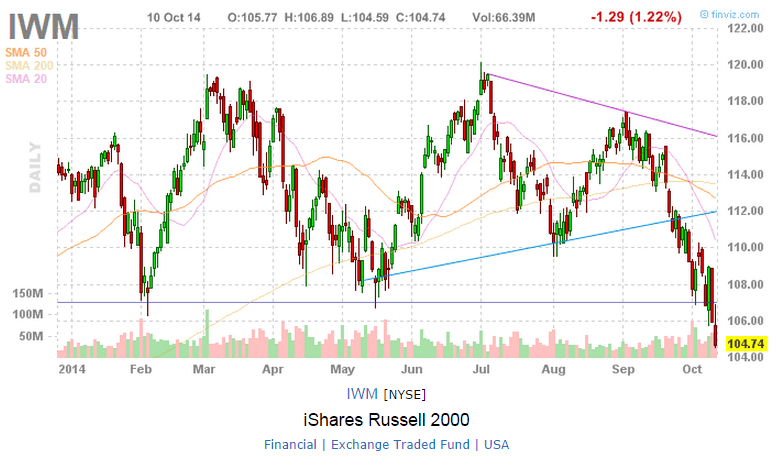
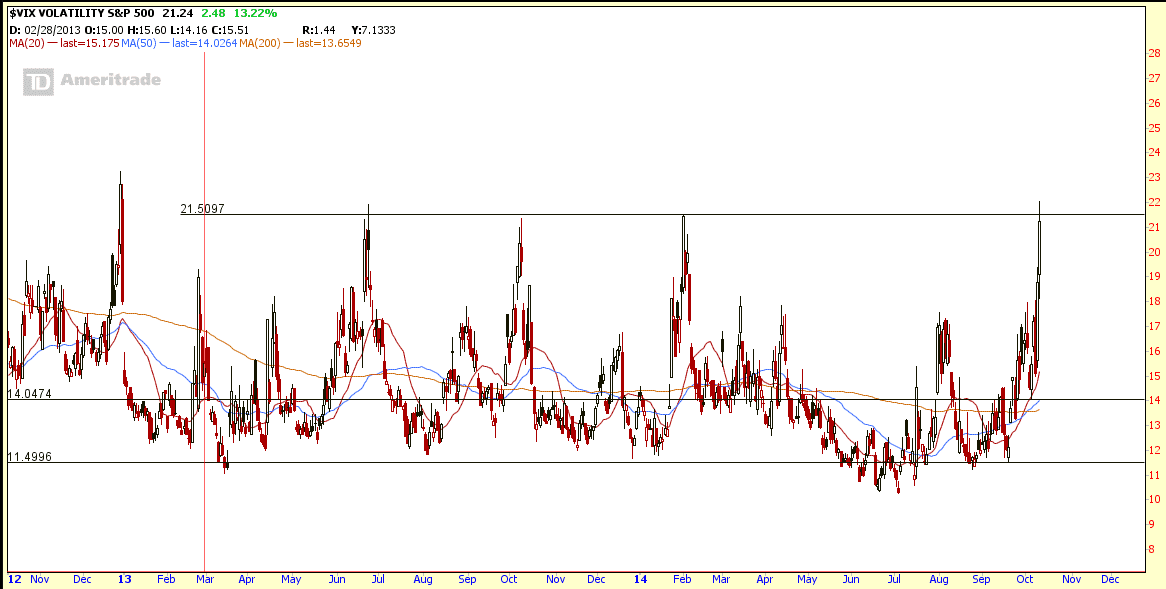
DIA, SPY, QQQ and IWM all broke the support last Friday and VIX hit almost 2 Years high at 21.24!

However, DIA, SPY and QQQ are still not in technically bearish territory yet as they are still above the 200D SMA (trending up). Only IWM is officially in the down trend. Watch out for a technical rebound at 200D SMA.

DIA Oct10-2014 SPY Oct10-2014QQQ Oct10-2014IWM Oct10-2014

Looking at the VIX past 2 years pattern, the Fear will not last forever if there is a rebound at 200D SMA support. It is a high winning probability trade by shorting VIX at this level.

VIX Oct10-2014

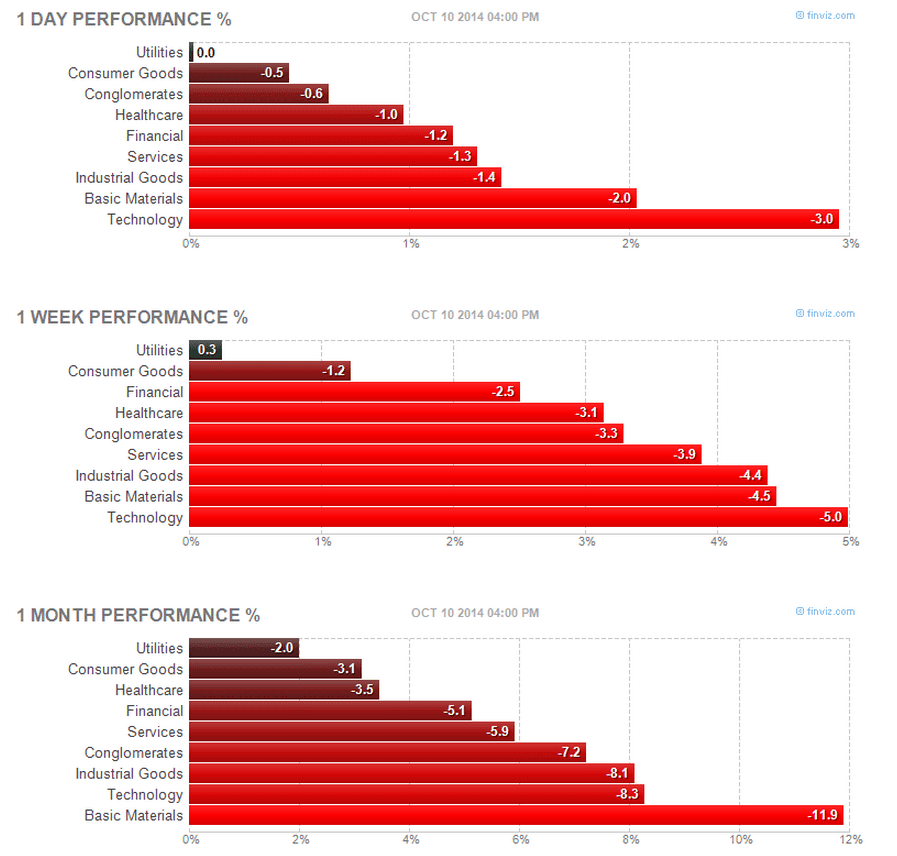
Healthcare, Consumer Goods & Utilities (Defensive sectors) are the better performing sectors relatively in the last one month. Technology & Basic Material are the worst performing sector. This is a typical sectors pattern in the bear market. Beware of the Big Bear Awakening!

S&P500 Heatmap Oct10-2014 Sector Oct 10-2014

Plenty of Trading Opportunities during the recent sell down:

  • Short Call Spread on DIA, SPY, QQQ  or IWM (after breaking the support)
  • Short Call Spread on VIX
  • Short Put Spread for DIA, SPY or QQQ (when rebound from 200D SMA)
  • Iron Condor (Sell Volatility)


Disclaimer: This is NOT the recommendation or trading tips. This post is for own analysis only.

Continue ReadingStock Market in RED! Is It Time to Short the Fear?

iShares Russell 2000 ETF (IWM): Rebound from Support

  • Post author:

iShares Russell 2000 ETF (IWM) rebounded from an important support at 108 with Piercing Pattern.

IWM Oct5-2014

Original Post by Marubozu My Stocks Investing Journey

Trade Setup

  • Strategy: Short Term Directional Bullish Trade.
  • Target: $113-$114
  • Short Put Spread IWM 108/112 Oct 2014 (2 contracts)
  • Max gain @ expiration $496
  • Max loss @ expiration $309
  • B/E @ expiration $109.52
  • Reward vs Risk (RoC) = 1.61
  • Probability OTM (short leg) = 63.25%
  • Profit target = $373 (at $114 200D SMA resistance)
  • Exit Conditions:
    • When there is a reversal pattern at the resistance ($114)
    • Break $108 support convincingly.
    • Reach 80% of Max Profit (ie. $396)

IWM Short Put Spread Oct5-2014


Continue ReadingiShares Russell 2000 ETF (IWM): Rebound from Support