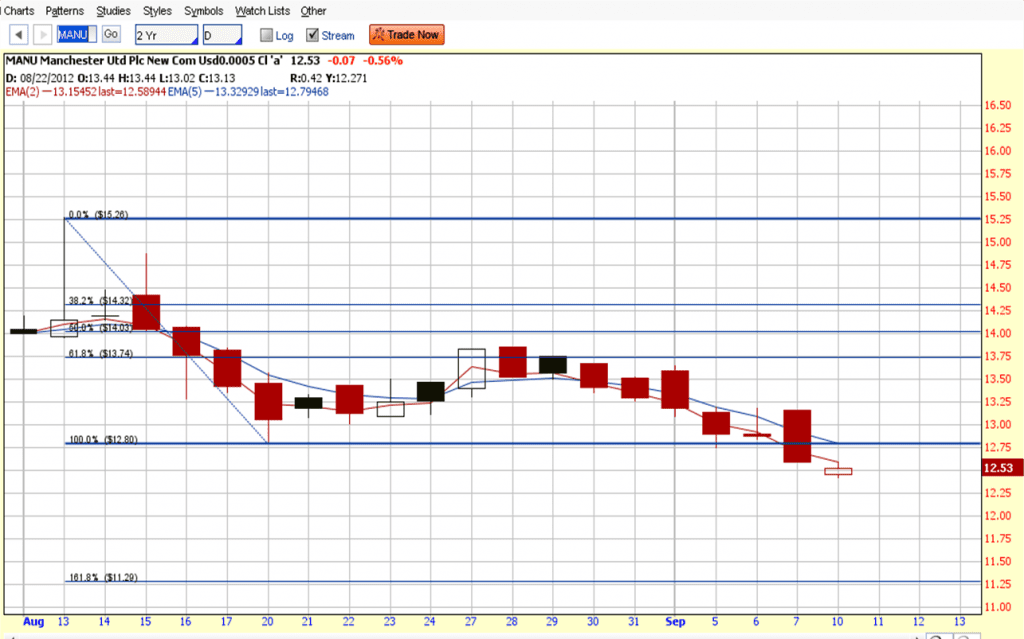
Manchester United (MANU): Score Own Goal!
No disrecpect to Man Utd fans… Stocks Investing and success in the Premier League are 2 different things. Base on the current chart and Man Utd’s fundamental, there is only one direction of the stock price, ie. down!
-
Immediate Resistance: $12.80
-
Next Support: $11.29 (use 161.8% Fibonacci Retracement Level to estimate)
Another Facebook IPO in making conning investor’s money – poor earning and fundamental, hype up with high valuation with “future hope”…. BTW, sad for investors but joy for traders! Have fun shorting!
Key Statistics for MANU
| Current P/E Ratio (ttm) | – |
|---|---|
| Estimated P/E (06/2012 ) | 44.2808 |
| Earnings Per Share (GBP) (ttm) | – |
| Est. EPS (GBP) (06/2012) | 0.1760 |
| Est. PEG Ratio | 80.5106 |
| Market Cap (M USD) | 2,037.89 |
| Shares Outstanding (M) | 39.69 |
| Enterprise Value (M GBP) (ttm) | 1,693.89 |
| Enterprise Value/EBITDA (ttm) | – |
| Price/Book (mrq) | 0.0295 |
| Price/Sale (ttm) | – |
| Dividend Indicated Gross Yield | -% |
| Next Earnings Announcement | – |

