Apple (AAPL) Trade Idea

  • Post author:

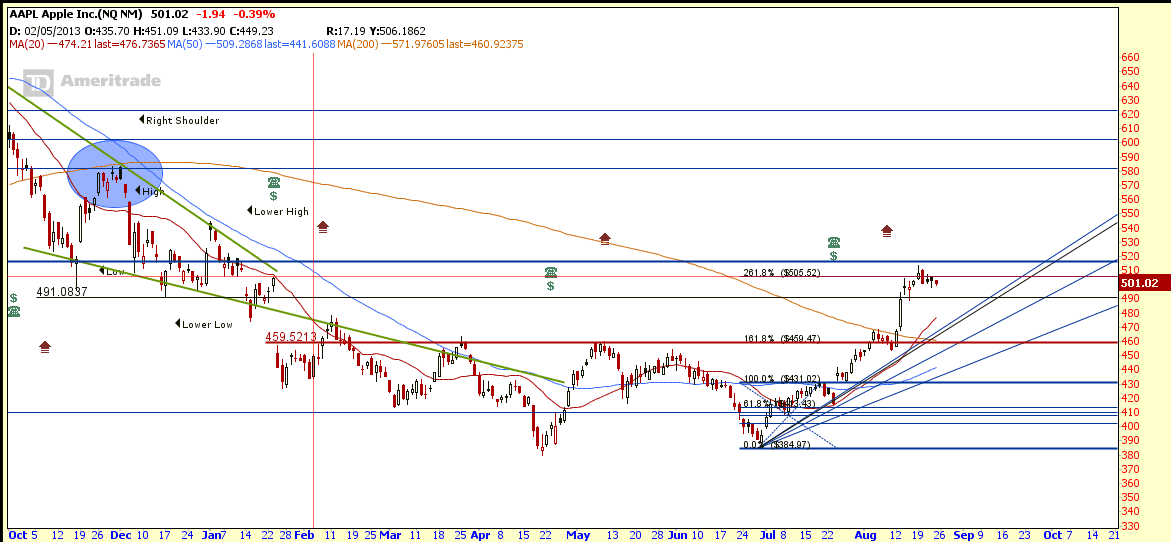
Chart Pattern: AAPL breakout from Inverted Head and Shoulders with neckline about $460. AAPL also broke the 200D SMA resistance and technically entered into bullish trend. The stock also retraced to retest the neckline support to confirm this is a successful breakout.

Trading Strategy: Short Put Spread.

  • Target Entry zone:
    • Scenario 1: $470-$480 when AAPL retraces back to Fibonacci Fan support. Currently AAPL is facing the 261.8% Fibonacci Resistance.
    • Scenario 2: If AAPL breakouts from current Bull Pennant / Bull Flag (above $510)
  • Scenario 1
    • STO AAPL Oct 13 480 Put
    • BTO AAPL Oct 13 470 Put
  • Scenario 2
    • STO AAPL Oct 13 510 Put
    • BTO AAPL Oct 13 500 Put
  • Minimum Price Target : $530 (Inverted Head and Shoulders Breakout Target)

AAPL Chart

AAPL Aug23-2013


AAPL Fundamental

AAPL Fundamental Aug23-2013

AAPL Intrinsic Value

  • Operating Cash Flow = $52,894 Million
  • No of Shares outstanding = 908.5 Million
  • Beta = 0.98
  • Discount Rate = 6%
  • No Growth (0% for next 10 years), IV = $443
  • Conservative Growth (5% for next 10 years), IV = $563
  • Moderate Growth (9% for next 10 years), IV = $709
  • Adjusted Growth Rate (12% for next 10 years). IV = $826


Chart from thinkorswim, get FREE chart here.

Original post by Marubozu from My Stocks Investing Journey.


Continue ReadingApple (AAPL) Trade Idea

Gold Start to Rally?

  • Post author:

Gold Start to Rally? Yes. At least for the short term base on technical analysis because Gold has just broken the previous support turned resistance. Looking at the GLD (SPDR Gold Shares ETF), GLD has broken the $130 critical resistance level and also moving above 20D / 50D SMA. Base on the past few months chart pattern, 20D SMA is a reliable support and resistance moving average line. The price target for this GLD rebound is about $139-$140 region base on 161.8% Fibonacci Expansion Level by mid Oct 2013 (using Fibonacci Fan).

GLD Aug17-2013

Statistically Aug and Sept tends to be bullish months for Gold. See statistical table here. 

  • Gold Short Term Trend: Bullish
  • Gold Long Term Trend: Bearish (200D SMA is still trending down)
Continue ReadingGold Start to Rally?

Caterpillar (CAT) Trade Idea

  • Post author:

Unable to enter any trade base on last trade idea on Caterpillar as CAT did not reach my target entry price. Fortunately the chart presented me another entry level few days ago. This time is a bearish entry when CAT was rejected at 200D SMA resistance and also the Symmetrical Triangle resistance. In addition, the candlestick patterns were shouting LOUD and CLEAR at me with Shooting Star and Bearish Engulfing patterns.

CAT Aug17-2013

Trading Strategy: Short Call Spread Sept 13 85/90

  • Direction: Bearish (Rejected at Symmetrical Triangle Resistance and 200D SMA resistance)
  • STO CAT Sept 13 85 Call
  • BTO CAT Sept 13 90 Call
  • If  the  resistance (about $87) is broken, close both legs to cut loss.
  • Entry Price: $86.22
  • Breakeven Price: $87.01
  • Max Profit: $603
  • Max Loss: $897
  • Reward vs Risk: 0.67
  • Probability Price Below Breakeven: 65%
  • Exit Target: CAT price near to the Symmetrical Triangle support about $81-$82 region

Chart from thinkorswim, get FREE chart here.

Continue ReadingCaterpillar (CAT) Trade Idea