Citigroup (C): On Uptrend Channel
Citigroup is currently trading within an up trend channel. It is expected to see C continues the bullish trend after rebounding from the channel support (also the 61.8% FR) with a hammer candlestick.
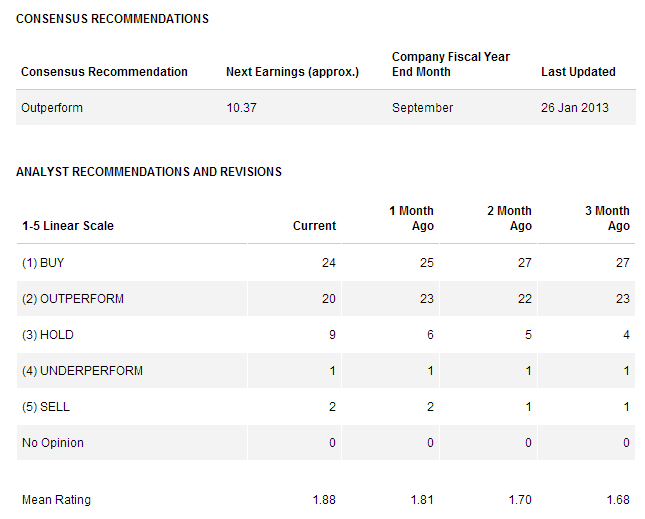
Fundamentally, the valuation of C looks attractive from PE ratio, PEG and P/B perspective.
Key Statistics for C
| Current P/E Ratio (ttm) | 10.4408 |
|---|---|
| Estimated P/E(12/2013) | 9.0153 |
| Relative P/E vs. SPX | 0.7044 |
| Earnings Per Share (USD) (ttm) | 3.9700 |
| Est. EPS (USD) (12/2013) | 4.5800 |
| Est. PEG Ratio | 0.9199 |
| Market Cap (M USD) | 125,548.21 |
| Shares Outstanding (M) | 3,028.90 |
| 30 Day Average Volume | 30,836,774 |
| Price/Book (mrq) | 0.6732 |
| Price/Sale (ttm) | 1.3370 |
| Dividend Indicated Gross Yield | 0.10% |
| Cash Dividend (USD) | 0.0100 |
| Last Dividend | 01/31/2013 |
| 5 Year Dividend Growth | -70.97% |
| Next Earnings Announcement | 04/16/2013 |


