Dryship (DRYS): Uptrend is Going to Start!
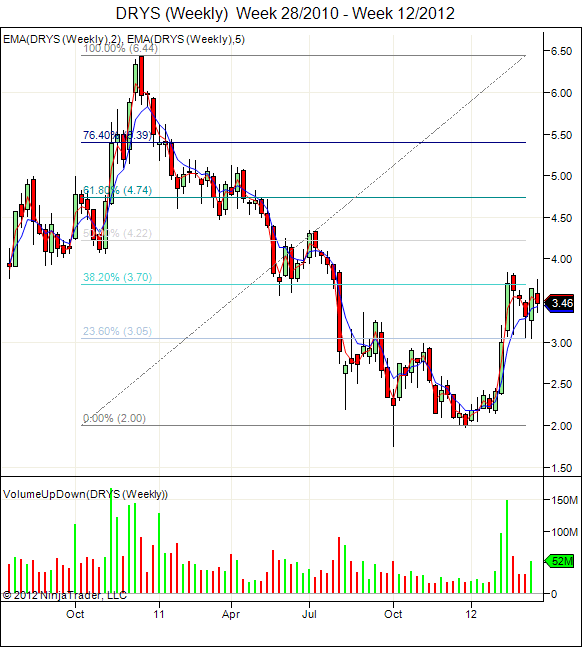
Dryship (DRYS) is currently in a consolidation mode forming a Bullish Pennant Pattern from the weekly chart.
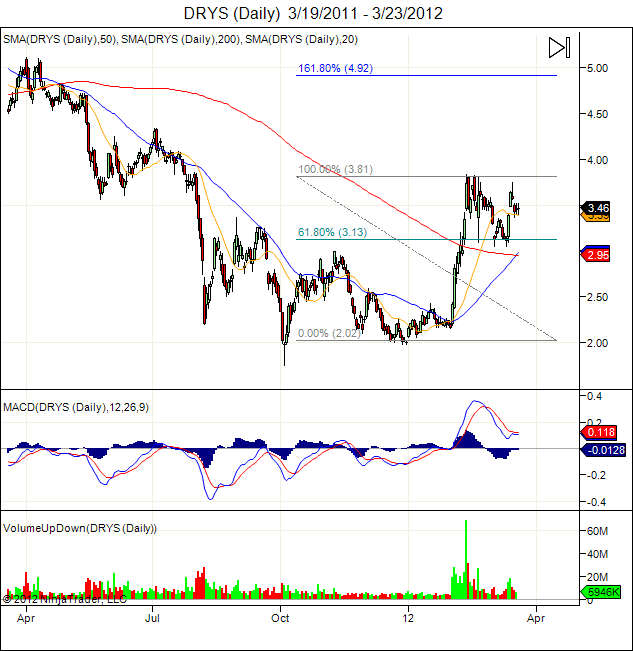
As for daily chart, DRYS rebounded from the 61.8% FR support and maybe forming a “Higher High, Higher Low” up trend pattern. 50D MA has just crossed 200D MA which is also a bullish signal. Short term price target is $4.92 (161.8% FR) if DRYS manages to break $3.81 resistance.
As for the long term price target, you can take a look at the chart below and make your prediction! Historical High is close to $130! This chart is a typical example of how a Parabolic Curve looks like. Go up extremely fast and coming down as fast too! Do you think this stock worth the gamble for your retirement fund? If you believe history always repeat itself, you can do your calculation and looks at the upside potential. Good luck!
Disclaimer: This is my personal analysis and not a Buy or Sell recommendation to anyone. I held no responsibility for anyone profit or loss for any information shared here.


