United State Natural Gas Fund (UNG): Start Up Trend?

  • Post author:

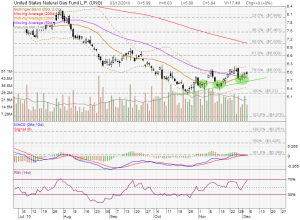
UNG seems that has bottomed up and starting an uptrend. UNG bounced off twice from the 20D MA support and current chart shows a nice uptrend (in green line). Also take note that 20D MA just crossed the 50D MA, MACD and RSI are showing bullish signals too. Current price is a good entry level for long term investment. CLICK HERE for my previous introduction on this Natural Gas ETF (UNG).
Continue ReadingUnited State Natural Gas Fund (UNG): Start Up Trend?

US Financial ETF (XLF): Start Up Trend?

  • Post author:

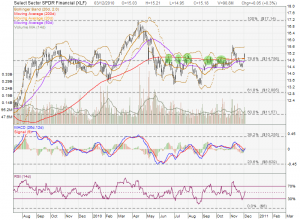
Financial ETF (XLF) looks like breaking the 200D MA resistance and 78.6 Fibonacci Resistance at $14.756. This resistance proved to be a very tough resistance as XLF failed to break for past 5 times. MACD and RSI are showing bullish signal on this breakout. However, XLF needs to come back to test this 200D MA as support before the uptrend is confirmed.

Continue ReadingUS Financial ETF (XLF): Start Up Trend?

Citigroup (C): Forming a Rising Wedge

  • Post author:

Citigroup is currently forming a long term Rising Wedge. Currently Citigroup seems that starting an uptrend from Sept 2010 to Dec 2010 where the C stock price is trading above 20D, 50D and 200D MA.  We can see that the 200D MA is trending upwards which is a uptrend sign. C also bounced off from the 200D MA support for the past 3 occasions. Current price looks like a good entry point for long term investment. The resistance is the Rising Wedge Resistance at about $5.00.

Continue ReadingCitigroup (C): Forming a Rising Wedge