United State Natural Gas Fund (UNG): Start Up Trend?

  • Post author:

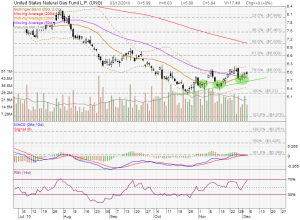
UNG seems that has bottomed up and starting an uptrend. UNG bounced off twice from the 20D MA support and current chart shows a nice uptrend (in green line). Also take note that 20D MA just crossed the 50D MA, MACD and RSI are showing bullish signals too. Current price is a good entry level for long term investment. CLICK HERE for my previous introduction on this Natural Gas ETF (UNG).

Continue ReadingUnited State Natural Gas Fund (UNG): Start Up Trend?

Energy ETF: Oil (USO) and UNG (Natural Gas)

  • Post author:

If you are looking for no brainer stocks investment opportunity, you can look at these two energy ETF, USO (United States Oil Fund) and UNG (United States Natural Gas Fund). Energy is a necessity is any economy and we need it every day. Imagine how we are going to live in the modern day without energy.

Energy related stock or ETF have direct correlation with the economy activities. When economy recovery gathers pace, the energy demand and consumption increase and thus drive the energy price up.

Looking at both USO and UNG charts, these two ETF are super under value and post the greatest upside potential. Downside is limited because now we are in slow recovery mode unless the whole world enters into double recession.

USO

  • Background:  The United States Oil Fund, LP (“USO”) is a domestic exchange traded security designed to track the movements of light, sweet crude oil (“West Texas Intermediate”). USO issues units that may be purchased and sold on the NYSE Arca.
  • Historical High: US$118
  • Current Price: about US$36


UNG


  • BackgroundThe United States Natural Gas Fund LP (UNG) is an exchange traded security that is designed to track in percentage terms the movements of natural gas prices. UNG issues units that may be purchased and sold on the NYSE Arca.
  • Historical High: US$64
  • Current Price: about US$6

Assuming both ETF shoot up to HALF of the historical high when the economy is fully recover, you can do your math how much upside potential the ETF have…. If you look back the chart in Jan – June 2008, you can see how the bull pushed the price up close to 100% within 6 months. If you time it right, you will be able to achieve your handsome retirement plan. If you are not good at how to time the entry, you can just start to accumulate these ETF and hold for a few years. I am sure you will be rewarded pretty handsomely because you are buying low now and selling high later.

Additional Useful Information for your reference:

  • What is ETF? A security that tracks an index, a commodity or a basket of assets like an index fund, but trades like a stock on an exchange. ETFs experience price changes throughout the day as they are bought and sold.  You can view the video here.
  • If you want to learn how to trade ETF safely, click here.
  • If you want to find out more on the energy related information for your long term investment, check it out the report here. Hottest Investment Plays In North America: Oil And Gas Bulletin. – by Keith Schaefer

Disclaimer: This is my own analysis and it is not a recommendation to buy or sell the ETF. Use the information at your own risk.
Continue ReadingEnergy ETF: Oil (USO) and UNG (Natural Gas)

UNG – Going To Reverse The Trend!

  • Post author:

UNG is showing signs of reversing a down trend to up trend. Technically & fundamentally (economy perspective) this Natural Gas ETF is due for a long term up trend. I summarise my Technical Analysis and Fundamental Analysis as below:

Fundamental Analysis (Economic Perspective)

  • Economy has started to recover. The demand of natural gas will increase due to increasing economy activities like manufacturing, transportation likes car and truck, cold winter, etc.
  • Natural gas is another sort of popular green energy to be used widely in future where the world is determine to cut emissions of greenhouse gases.
  • Natural gas will be part of the energy substitution to petrol for all the car users.
  • Due to the low economy activities during the recession, natural gas is over supply and thus, there is no more natural gas storage space left. The major gas producers are now being forced to cut production; a move which may actually be beneficial to the industry as a whole as it will likely help boost prices, thus restoring margins for many producers.

Technical Analysis (Base on Chart Patterns)

  • A double bottom (or inverted head and shoulders) has been formed.
  • UNG broke out from the falling wedge resistance with increase in trading volume.

Things to look out for

  • The falling wedge resistance turns support, i.e. the stock price does not return to the falling wedge.
  • UNG breaks the $12.25 resistance (61.8% Fibonacci Retracement Level). This level is also probably the 200D MA if I extrapolate the 200D MA line.
  • The next lower low does not happen below $8.50 (historial low!)
  • 20D crosses over 50D MA.
Continue ReadingUNG – Going To Reverse The Trend!