USD/SGD: Shooting Star and Evening Star
USD/SGD is showing a Shooting Star and Evening Star, Bearish Reversal pattern at the resistance. This may be a Double Tops in formation.


USD/SGD is showing a Shooting Star and Evening Star, Bearish Reversal pattern at the resistance. This may be a Double Tops in formation.
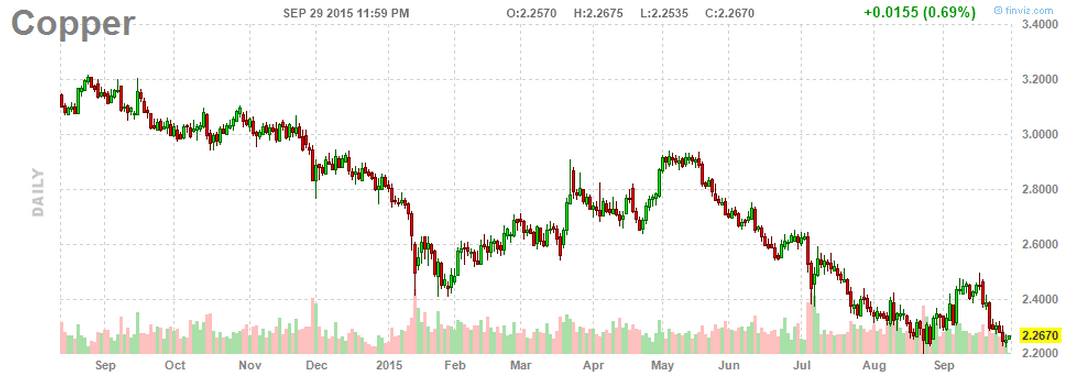
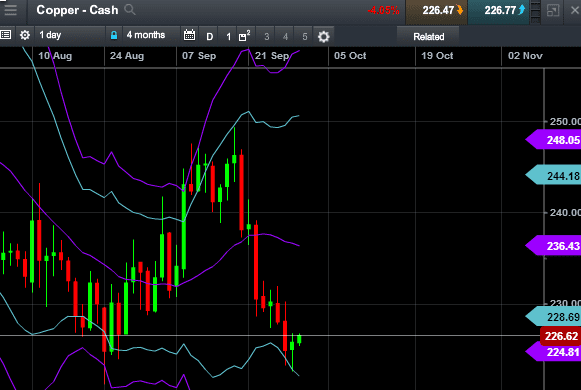
Copper has formed a Hammer at the support on daily chart. This is a potential reversal pattern for short term trade. Copper may be forming a Double Bottoms chart pattern after the recent down trend.
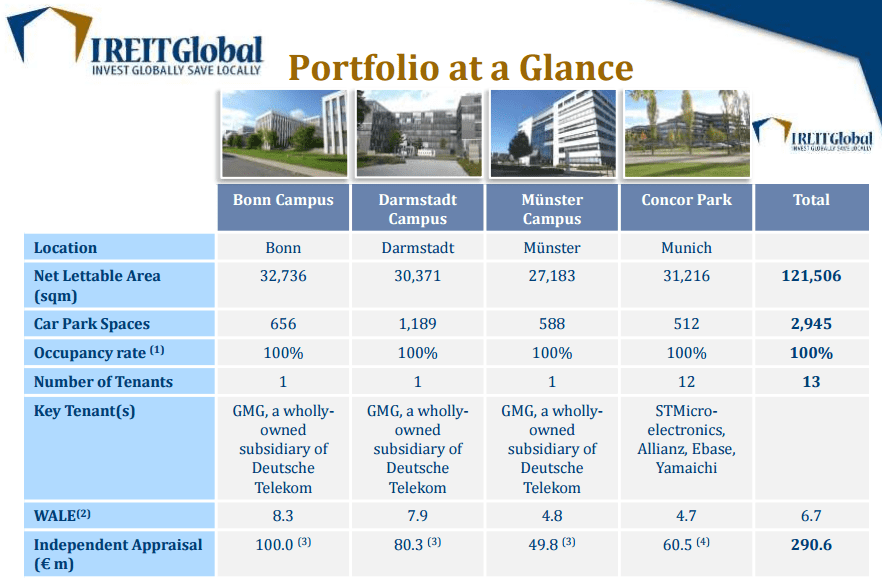
IREIT Global Investor Non Deal Roadshow on Mar 2015
See IREIT Global IPO information here.


IREIT Global Technical Analysis & Stock Chart
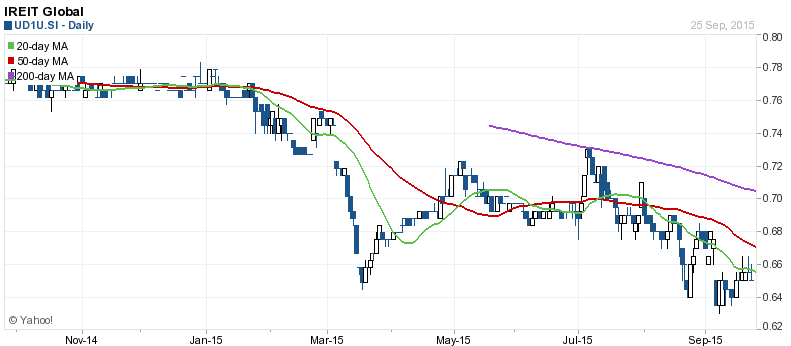
IREIT Global has broken the 200D SMA support and currently in on the down trend.
Germany PMI and GDP Growth looks healthy but not very strong.


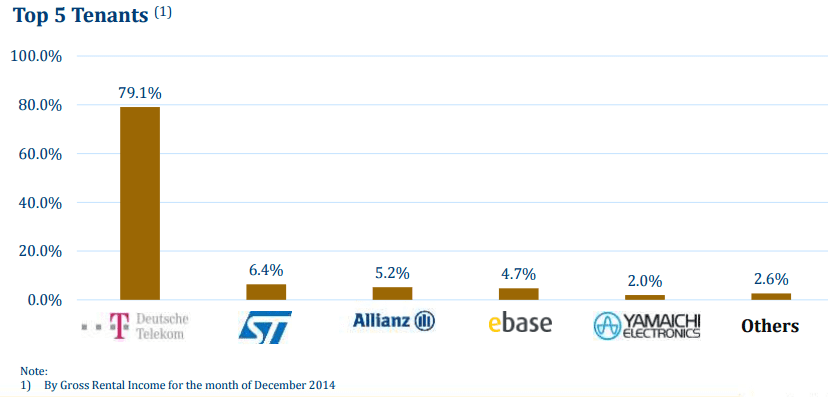
Although the 9.85% yield looks very attractive and the trust is undervalue, there are forex risk and tenant diversification risk. Do your Due Diligence before investing.
Check out Singapore REIT Course here on how to identify the risks and analyse the sustainability of Singapore REIT. https://mystocksinvesting.com/course/singapore-reits-investing/