Rob Turp
Prior to the advent of the Internet, and the introduction of high speed broadband, trading currencies was reserved for banks and financial institutions, as well as some large businesses looking to protect against currency fluctuation. Thanks to cable Internet speeds, more reliable home computers, and a number of beneficial factors that are unique to Forex trading, it has become increasingly accessible to many more people. You won’t become a successful Forex trader overnight, but with a lot of research and education, as well as some practice and further education, you can successfully trade currencies.
Market Liquidity
The currency market is an extremely liquid market with considerably more money changing hands than with stocks and shares, bonds, or any other global market. It is also open 24 hours a day, and this combination means that it is possible for the trader to trade at any time. It even makes it possible to set stop losses or to stop at a certain profit level.
This liquidity also means that brokers typically offer a high leverage, sometimes as high as 200:1. Effectively, to trade £200,000 of a currency, you would only need to invest £1,000 in the trade. Different accounts can have different leverage levels, but regardless of the leverage ratio, you should ensure that you only risk a small amount of your investment bank, and many traders will suggest accounts with low leverage are better for the novice trader because it can prevent large and unrecoverable losses while you are still learning the ropes.
Demo Accounts
A demo account enables you to get to grips with the platform and the market. No matter how much research you have done into the Forex market, the platform itself can be overwhelming, and if you risk real money while you are still in the early stages, you could make a loss because of inexperience or because you haven’t yet picked up on the many nuances of trading. A demo account offers everything from news feeds to technical analysis, and it allows you to trade using “pretend” money. Even an intuitive platform, like ETX-Capital, needs to offer a lot of data and numerous features so it can seem baffling at first – better to be baffled when you aren’t risking real money.
Start Small
Once you understand the market, and you know how the trading platform works, you can consider moving to mini- or even macro-accounts. These enable you to open an account with only a small amount of money, typically a couple of hundred pounds. Do consider the leverage that is offered, and remember that risking everything or a large portion of your investment bank on a single trade could be the quickest way to see your dream of Forex profits shattered.
Specialisation
Despite the huge amounts of money that are traded every hour, there are only a limited number of currency pairs available to trade. In fact, there are four primary pairs that are traded most often. In contrast, there are thousands of stocks available to trade on a single index, and as well as the challenge of knowing exactly which stocks to trade, you will also need to find somebody to buy or sell shares before you can trade. This can be especially difficult with lesser known stocks, and those with minimal movement.
The key to profitable Forex trading is knowledge, and by concentrating on a handful of pairs, it is possible to learn more about each, keep a keen eye on the different signals and indicators that drive or indicate movement. Because of the number of trades and the amount of currency that is traded every day, there will still be opportunity to trade regularly according to the trading system or rules that you establish.
The Right Equipment
While you may not need bank upon bank of computer keyboards and monitors, like you see on TV and in films, you certainly need a decent system and two monitors can certainly help you keep an eye on things. A good computer is important so that you can trade instantly, and so that you don’t get stuck with a currency or miss out on an opportunity that you would have traded.
Your Internet connection is also important. Dial-up connections are thankfully rare nowadays, but if you want to ensure there is little or no lag when using trading software, then you should look into cable or fibre optics, or into dedicated connections. You will use your Internet connection to display live feeds, updated prices, and other information related to the markets and to your own trading position, and even a delay of a few seconds means that you could miss out.
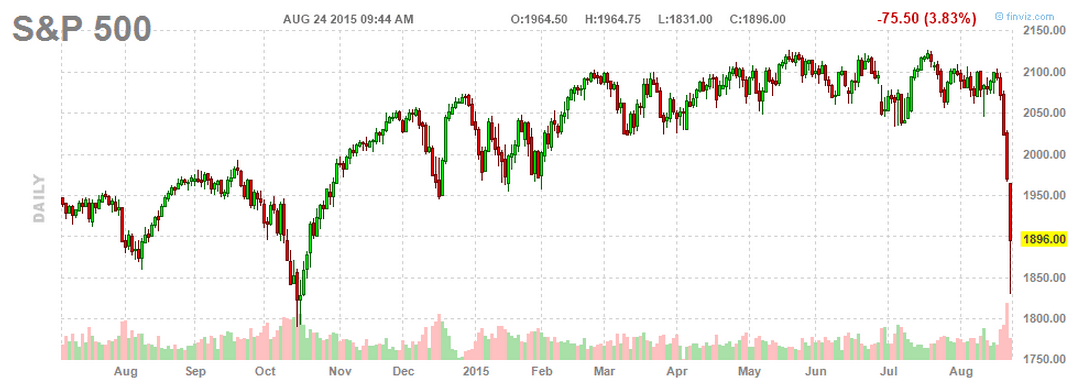
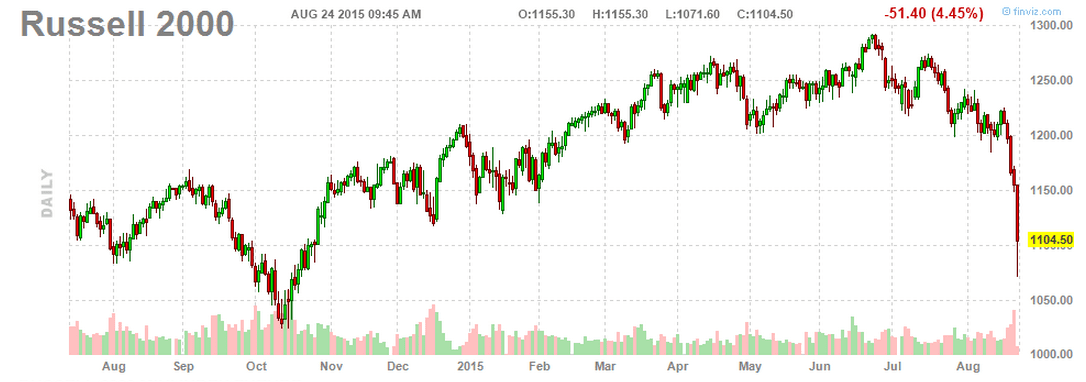
Technical Analysis
Day traders are those that will usually require the fastest and most effective systems, and may rely on multiple monitors, primarily because of their reliance on data-intensive charts and graphs that are used for technical analysis.
Day traders do not hold a position overnight, and will look to close trades before the end of the trading day, typically at 5pm. This is where technical analysis is commonly relied upon; in order to identify support and resistance levels and knowing the best time to close out a trade. A day’s hard work can be easily undone if you are unable to close your trades out effectively and efficiently, and experienced traders will have hourly, daily, and annual charts open.
The charts are really only a tool, but they are an essential one, and if you hope to become a professional trader, then you will need to learn how to read them, and how to spot the many indicators that exist. It is the charts that will enable you to identify and spot trends, so that you can act on them quickly, so you will have to have access to charts that update live and in a format that you can understand and translate quickly.
Trading Systems
A good trading system should include hardware, software, live data, and heaps of knowledge. What’s more, you will also need experience in order to be able to spot trends, to be able to quickly open and close trades, and to have a greater chance of turning a Forex profit. It may not be an easy road to currency exchange profits, but with the right vehicle, it does offer potential reward for your risk and effort.