Noble Group: Down Trend Channel
Noble is currently trading within a Down Trend Channel and capped by the declining 50D SMA resistance. Another nice stock chart to short sell.
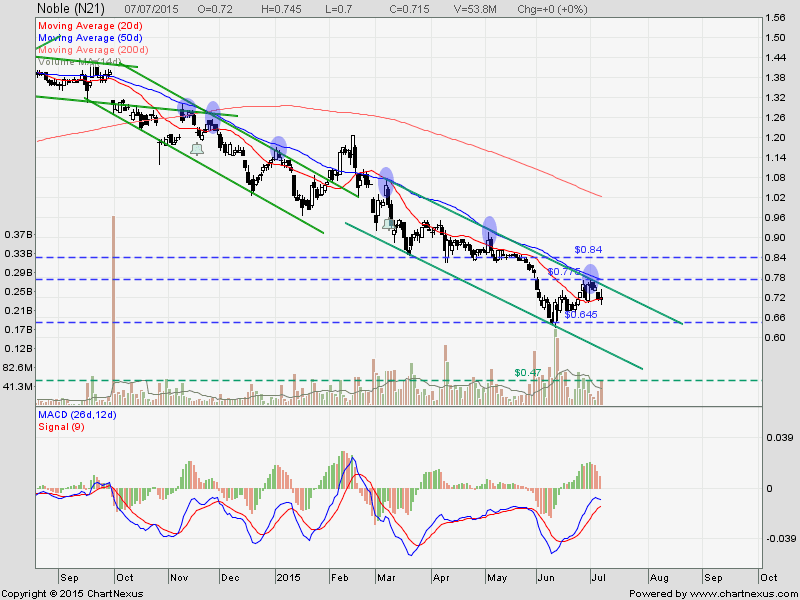

Noble is currently trading within a Down Trend Channel and capped by the declining 50D SMA resistance. Another nice stock chart to short sell.
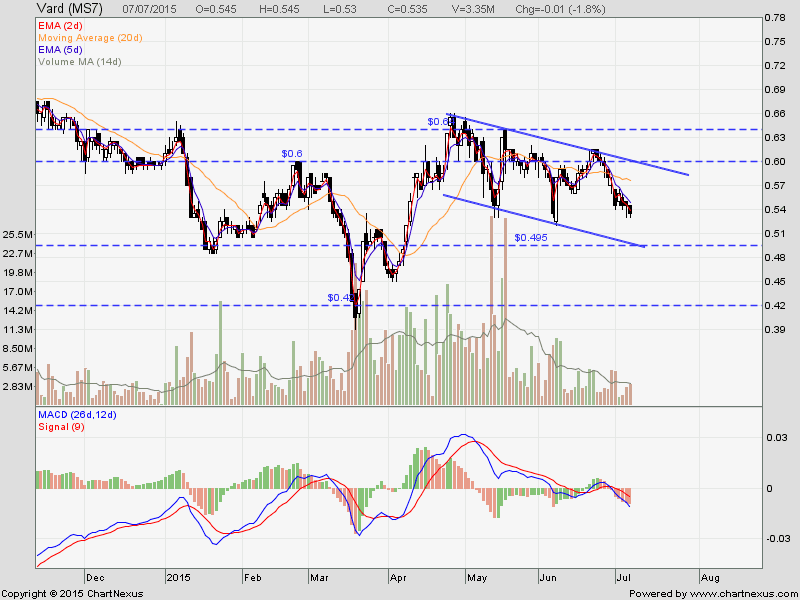
Vard is currently trading within a down trend channel. Enjoying a slow and steady short selling trade in this counter.
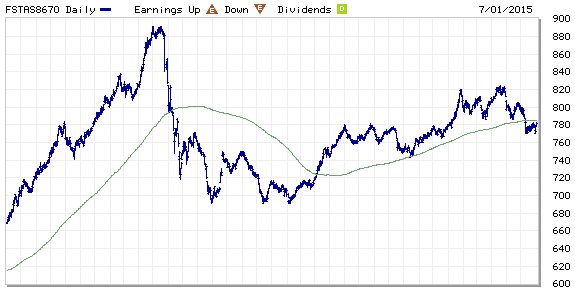
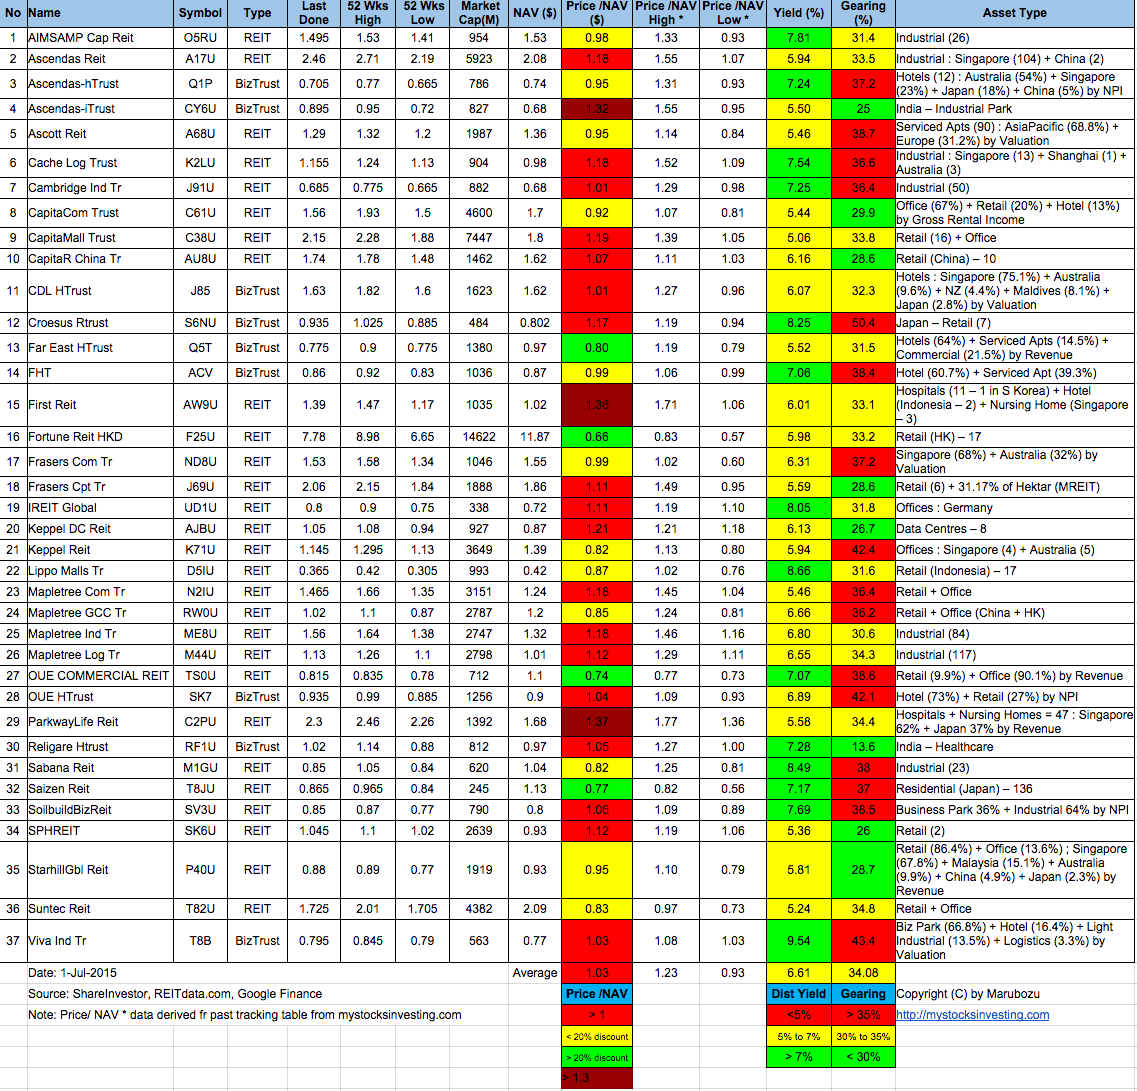
FTSE ST Real Estate Investment Trusts (FTSE ST REIT Index) decreases from 795.76 to 781.09 compare to last post on Singapore REIT Fundamental Comparison Table on June 1, 2015. The index has broken down from the 200D SMA support and trading below 20D/50D/200D SMA. Down trend has been started for Singapore REITs in general as “Lower Low, Lower High” chart pattern is formed. Immediate resistance at 785. Take note that the index has broken the Head and Shoulder neckline support. This is a trend reversal pattern.
Learn Stock Chart Pattern and Technical Analysis here.
Grab an insight of the REIT class here 3 Tips To Increasing Returns On REITs Investments
Check out the very pragmatic and educational public seminar here “Investing in Singapore REIT“.
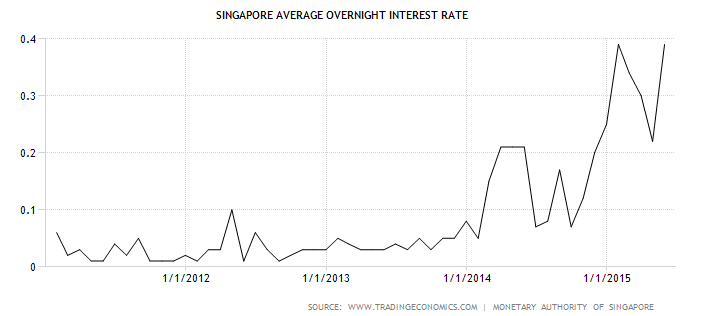
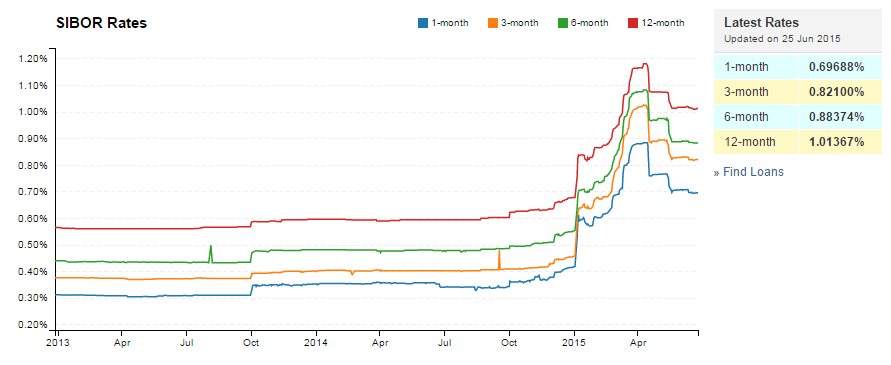
We have finished the month of June but US Federal Reserve still has not increased the interest rate yet. Interest hike will affect the borrowing cost, it is time for all the Investors to review your current investment portfolio and debt profile. Plan the next step before the day comes because it will affect your investment and loan monthly installment. Take initiative to evaluate your current mortgage loan and work on Refinance Plan before the mortgage loan interest shot up even further.