SingPost: Amazingly hitting 261.8% Fibonacci Retracement Level

  • Post author:

Amazingly seeing SingPost hit the 261.8% Fibonacci Retracement Level after re-plotting the chart after 1 year +. See last chart for SingPost here. Currently SingPost is just sitting above the 200D SMA support.
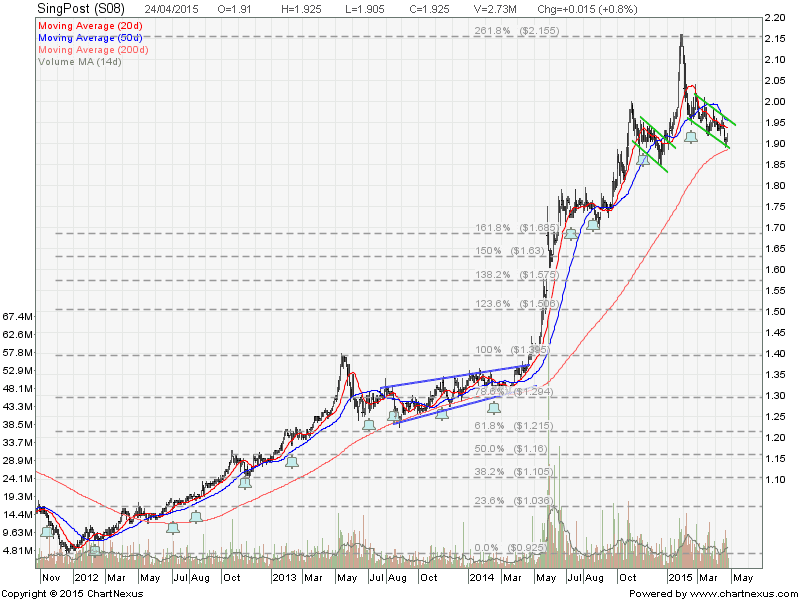
SingPost April25-2015

  • 0% FR: $0.925
  • 100% FR: $1.395
  • 61.8% FR: $1.215
  • 161.8% FR: $1.685
  • 261.8% FR: $2.155


Current P/E Ratio (ttm) 28.8996
Estimated P/E(03/2015) 26.3699
Relative P/E vs. FSSTI 2.0463
Earnings Per Share (SGD) (ttm) 0.0666
Est. EPS (SGD) (03/2015) 0.0730
Est. PEG Ratio 2.3821
Market Cap (M SGD) 4,132.76
Shares Outstanding (M) 2,146.89
30 Day Average Volume 5,382,967
Price/Book (mrq) 6.0138
Price/Sale (ttm) 4.8840
Dividend Indicated Gross Yield 3.25%
Cash Dividend (SGD) 0.0125
Dividend Ex-Date 02/13/2015
5 Year Dividend Growth 0.00%
Next Earnings Announcement 05/15/2015
Continue ReadingSingPost: Amazingly hitting 261.8% Fibonacci Retracement Level

Frasers Centrepoint Trust: Bullish Breakout!

  • Post author:

Frasers Centrepoint Trust breakout from an Ascending Triangle with spike in volume! The stock hit the breakout price target base on the Technical Analysis on Chart Pattern.

Frasers Centrepoint Trust April24-2015

  • Last Done Price = $2.15
  • NAV = $1.85
  • Price /  NAV = 1.16 (16% Premium)
  • Price /  NAV (High) = 1.488
  • Price /  NAV (Low) = 0.949
  • Distribution Yield = 5.35%
  • Gearing Ratio = 28.6%

Singapore REIT Data Comparison Table.

Continue ReadingFrasers Centrepoint Trust: Bullish Breakout!

KepCorp: Rejected at 200D SMA Resistance

  • Post author:

KepCorp share price is rejected at 200D SMA Resistance after breaking out from the Double Bottoms. Is this only a Dead Cat Bounce before continuing the down trend for Kep Corp? Keep a close eye on the support zone between $8.90 and $9.00.

2015April17-KepCorp-800x600

Original post by Marubozu My Stocks Investing Journey.

Current P/E Ratio (ttm) 8.8179
Estimated P/E(12/2015) 10.3700
Relative P/E vs. FSSTI 0.6222
Earnings Per Share (SGD) (ttm) 1.0490
Est. EPS (SGD) (12/2015) 0.8920
Est. PEG Ratio 10.8814
Market Cap (M SGD) 16,760.64
Shares Outstanding (M) 1,811.96
30 Day Average Volume 4,629,987
Price/Book (mrq) 1.5486
Price/Sale (ttm) 1.2816
Dividend Indicated Gross Yield 5.19%
Cash Dividend (SGD) 0.3600
Dividend Ex-Date 04/22/2015
5 Year Dividend Growth 5.12%
Next Earnings Announcement 07/24/2015

Another thing to watch is the Crude Oil stock chart. Crude Oil is currently showing a Double Bottom, a trend reversal chart pattern, but testing the neckline resistance.

Crude Oil April17-2015

Continue ReadingKepCorp: Rejected at 200D SMA Resistance