ST Engineering – The Magic 50D SMA!
ST Engineering rebounded from 50D SMA support!
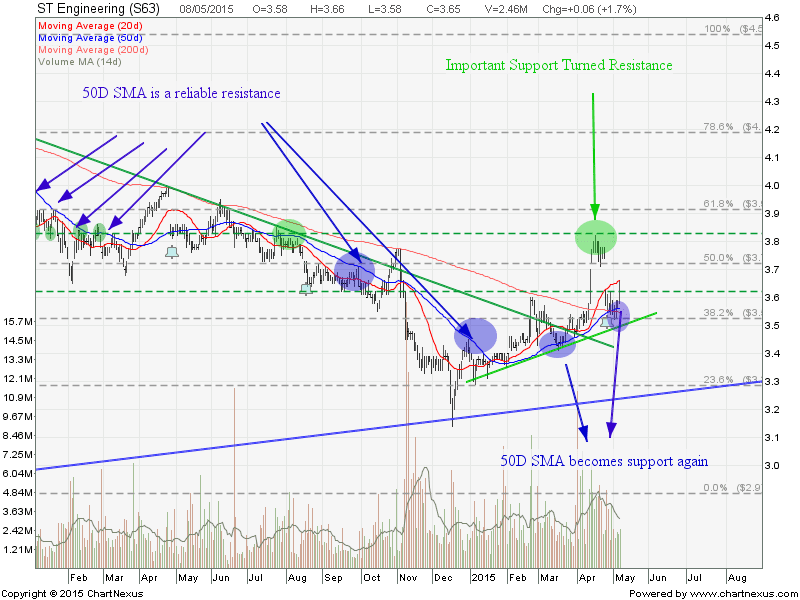
See last post of ST Engineering here.
Take note that ST Engineering earning release on May 13!

ST Engineering rebounded from 50D SMA support!
See last post of ST Engineering here.
Take note that ST Engineering earning release on May 13!
Good summary by one of my students from Singapore REIT investing class.
Original post from http://kkblog-kk.blogspot.sg/2015/03/blog-post_31.html
新加坡的房地产投资信托(REITs)在条例的规定下,必须把租金收入的90%分发给单位持有人。因此,REIT为投资者提供了稳定的股息收入,而投资者也受到这些REIT所提供的获益率(yield)所吸引。
在新加坡上市的REIT有超过30个,投资者应该怎样挑选来获得最高的股息回报呢?
有见识的投资者肯定不会只看获益率,而是会同时细心审查REIT的基本面。
上周五,我参加了一个关于新加坡REIT的三小时投资讲座,它是由Kenny Loh主持,后者是投资博客“Marubozu”的主持人。Loh先生十分乐意与投资者分享他的经验和知识。他是一名兼职交易员,并在一家跨国公司位居要职。
不要在‘高位’买入
Loh先生强调的其中一个要点是永远不要在高位买入REIT。这好像是普通常识,但投资者却很容易疏忽这个重点。
这个概念不只适用于REIT,投资其他股票也适用。比较保守的Loh先生建议投资者不要在股票处于升势时买入,尤其是当股价创下新高时。
道理很简单,当你在高位进场时,股价的升幅可能有限,而潜在跌幅通常比较大。
在以下的先锋医疗产业信托(First REIT)例子里,我们用了总盈与亏的概念来说明。
如果投资者因为这只股在A点(高位,1.44元)时的5%不错获益率而进场,那么当股价下跌至B点(低位,1.00元)时,他的净亏损便达到25.6%。
资料来源:ChartNexus(获益率是按上个财政年度的股息计算)
这是一个简单的例子,说明了在高位进场可能会面对的潜在庞大跌幅。
认识不同类别的REIT
REIT的收入是来自其组合资产的租金,而REIT的表现是受到其潜在资产的收益所影响。
投资者必须注意,某些类别的REIT尽管在好景的时候会获得较高的收益,但它们面对的风险可能较大。
REIT大致可分为5个类别:
相信大部分投资者都同意,5个类别中,医疗保健REIT是最具防御性,因为这个类别的资产拥有较长的租约。此外,医疗保健业最不受经济周期影响,因为在经济低迷的时候,我们还是需要到诊所看病。
另一方面,酒店、工业及商业REIT则较容易受到业务周期影响。
目前而言,由于国内生产总值(GDP)增长预测遭调低及采购经理指数(PMI)与制造产值等数字疲弱,工业厂房的租约在续租租金方面可能难以调升,因此工业REIT的盈利增长可能放缓。
在未来一年,商业REIT在续租租金方面预期可以调升,因为需求增多。办公楼的供需方面如果出现缺口,就如在2008年环球金融危机之后,办公楼租金大幅下滑,正好提醒我们商业REIT在经济低迷的时期会大受打击。
挑选REIT的项目清单
在讲座中,Loh先生与我们分享了一些挑选REIT的准则,投资者不妨多加注意。其中包括了股息获益率最好是在5%以上及负债比低于40%。
Loh先生指出,他也会留意一些估值偏低的REIT,意味着其净资产值(NAV)比股价为高。可是,投资者必须注意,有些REIT一直以来的估值都是偏低,而这可能是因为其他基本因素导致。
与此同时,有些具防御性的REIT往往会被高估,因此我们最好是比较其历来的股价与净资产值比。当REIT目前的股价与净资产值比是接近我们观察区间的低端时,便是进场的好时机。
举个例子,凯德商务产业信托目前的股价与净资产值比是接近其5年的高位,意味着我们最好是等待一个较佳的时机才进场。
吉宝房地产信托的估值目前是在历来高位与低位的中间,如果投资者是比较保守,最好是再等候更佳的时机才进场。
虽然选股清单可以帮我们把挑选的范围缩窄,但我认为投资者最好在进场前,先清楚知道每个所挑选的REIT的基本面。采取正确的投资方法肯定可以提高我们获利的机会,并同时可以减低出现下滑的风险。
Mapletree Commercial Trust retraced back to previous resistance turned support at $1.53 (also the uptrend support). Is it a good entry point to invest and Buy on Dip? To me, this is a good trading opportunity instead of investing.

See previous post on Mapletree Commercial Trust here.
See Singapore REIT Fundamental Analysis here.