CapitaMall Trust Fundamental & Technical Analysis
- Fundamental Analysis of CapitaMall Trust:
- Type: Retail + Office
- Last Price = $2.09
- Market Cap: $7.34 Billion
- NAV = $1.79
- Price / NAV = 1.17
- Price / NAV (52 Weeks High) = 1.3913
- Price / NAV (52 Weeks Low) = 1.0508
- Distribution Yield = 5.43%
- Gearing Ratio = 33.8%
- Occupancy Rate = 98.8%
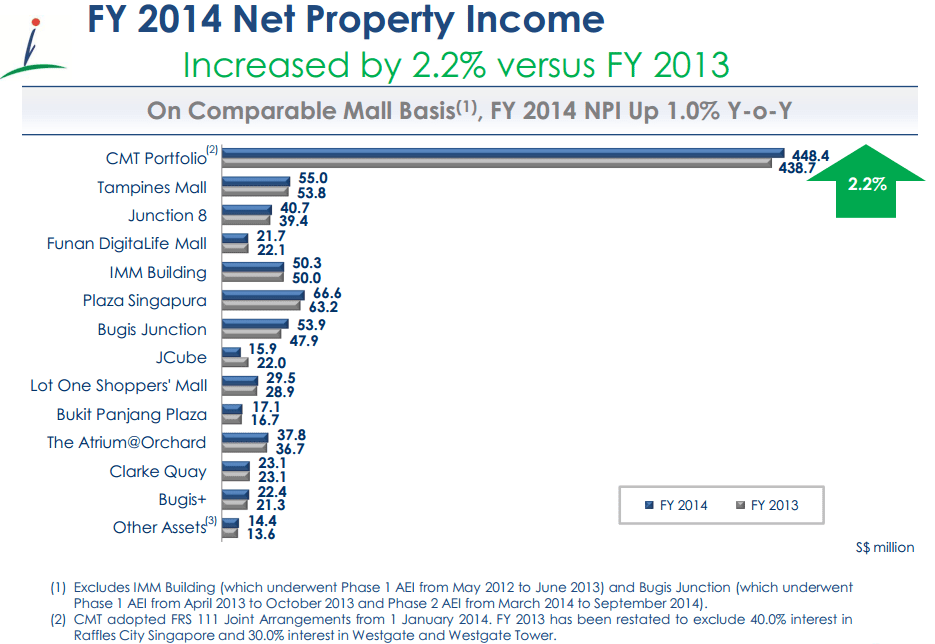
- CapitaMall Trust FY14 Presentation.
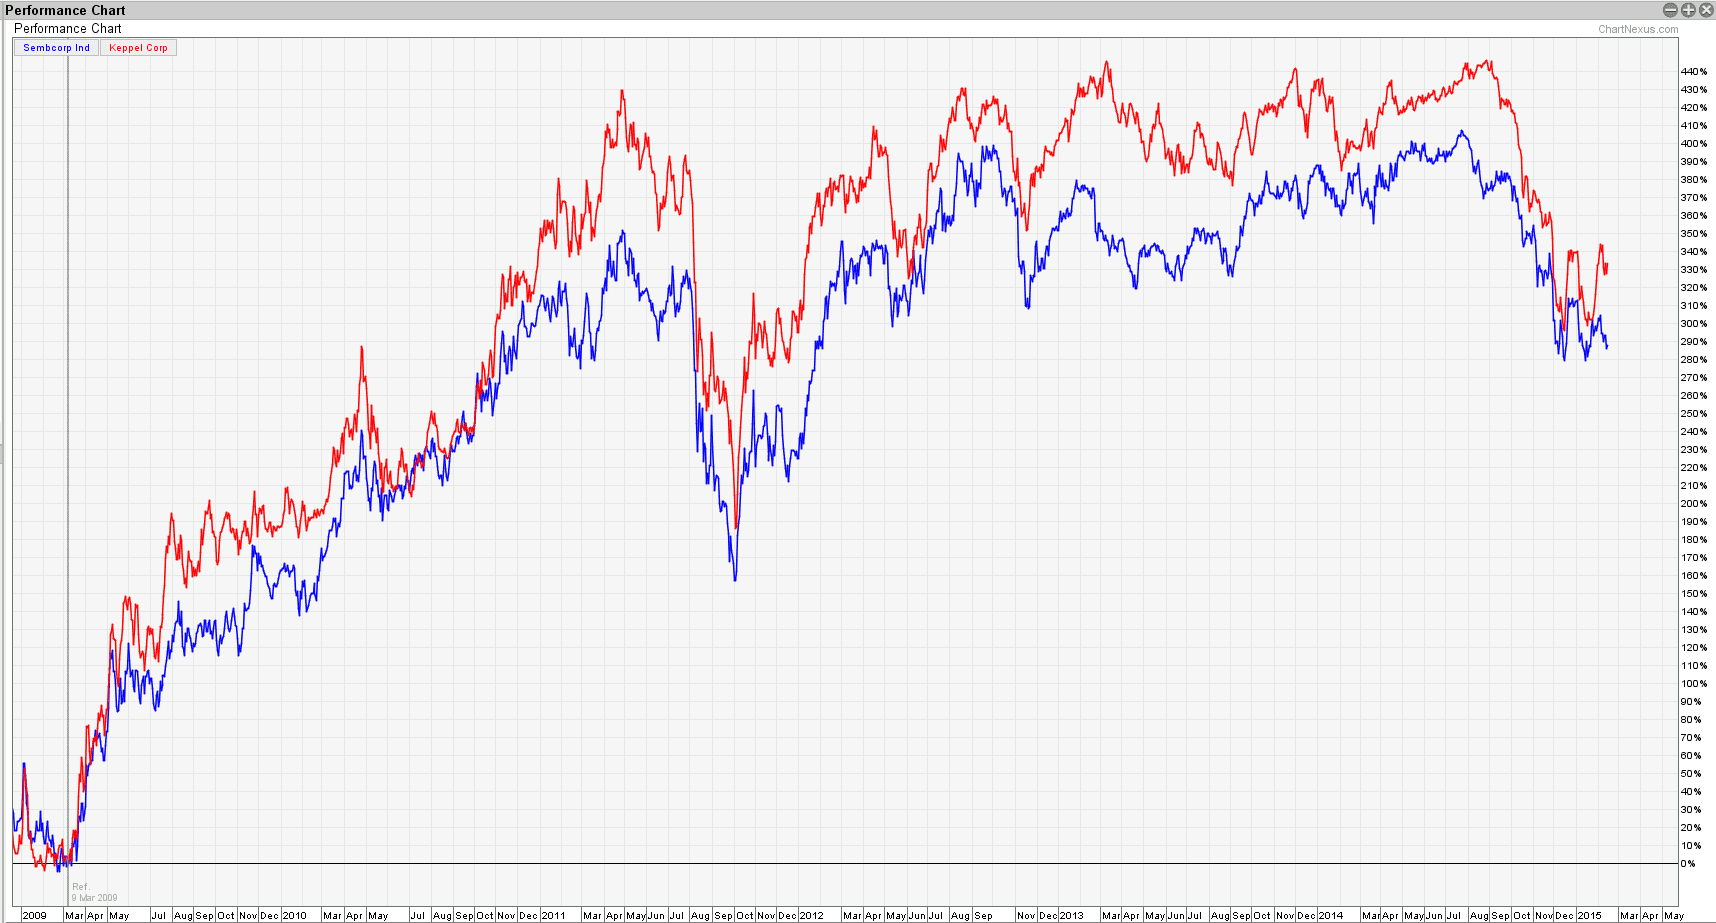
Other Singapore REIT Comparison Table.


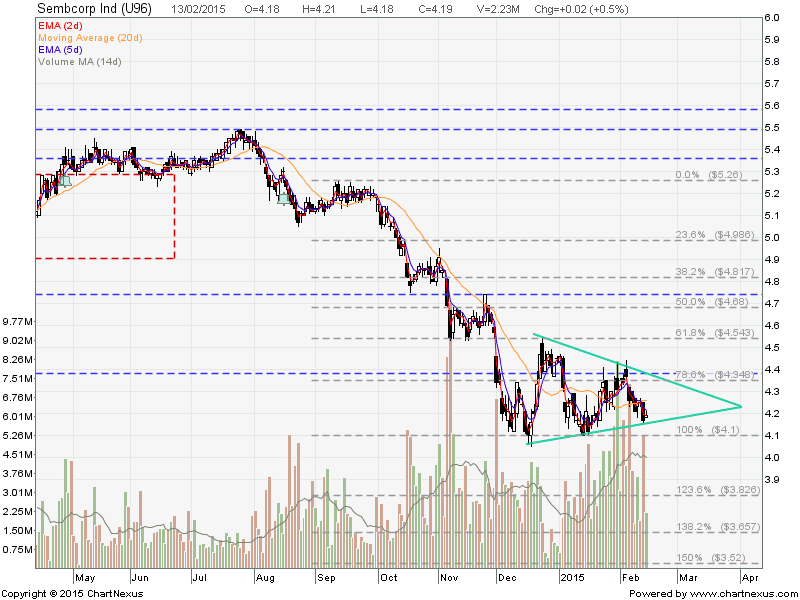
Technically CapitaMall Trust is on the up trend but getting to all time high of $2.23. Upside is limited base on valuation, distribution yield and stock chart.