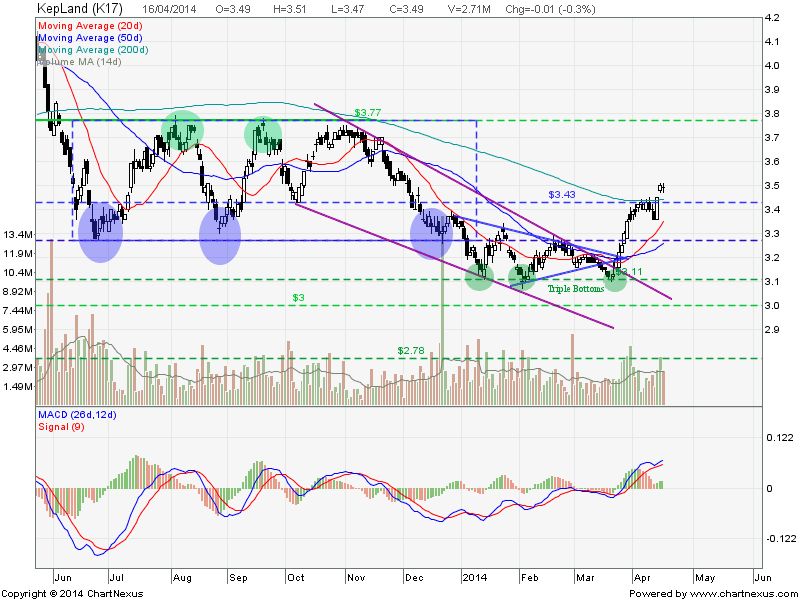
Low Risk High Value Stock Pick for Singapore REITs Dividend Investing

  • Post author:

These Bubble Charts are used to show the “relative” position compare to other Singapore REITs.

Note: NOT all the REITs have the same risk although they have very attractive distribution yield. High Distribution Yield does NOT mean it is safe. Vice versa, Low Distribution Yield does NOT mean the investment is no good. Investors must KNOW the risks involved when investing in Singapore REITs.

Two visual bubble charts to pick and avoid:

  1. Undervalue Singapore REITs with High Distribution Yield (Value Pick)
  2. Overvalue Singapore REITs with High Gearing Ratio (Risk Avoidance)

See Last Singapore REIT Bubble Charts here.

See detail Singapore REITs Fundamental Comparison Table here.

Singapore REIT Bubble Chart (Value) April5-2014Singapore REIT Bubble Chart (Risk) April5-2014

Disclaimer: This is NOT a recommendation to buy or sell. The authors do not guarantee the accuracy of the data and NOT responsible to any wrong interpretation by the readers.

Continue ReadingLow Risk High Value Stock Pick for Singapore REITs Dividend Investing

Singapore REIT Fundamental Analysis Comparison Table – 5 April 2014

  • Post author:

FTSE ST Real Estate Investment Trusts (FTSE ST REIT) Index changes from 714.18 to 731.88 compare to last post on Singapore REIT Fundamental Comparison Table on Mar 1, 2014. The index is trading above 200D SMA (moving sideway) after breaking out from a Descending Triangle. A trend reversal in making base on technical analysis.

FTSE ST REIT Index April4-2014

  • Price/NAV increases from 0.9687 to 0.9930.
  • Dividend Yield decreases from  6.84% to 6.72%
  • Gearing Ratio maintain at 34.00%.
  • Singapore REIT NAV Gearing Distribution Yield Comparison Table 5-Apr-2014
  • In general (base on quantitative analysis and technical analysis), most Singapore REIT is slightly under value now and the distribution yield is attractive (but with risks). Most of the Singapore REITs are trading in a consolidation range but some REITs have broken the 200D SMA resistance. These REITs may start an uptrend soon if they are able to stay above the 200D SMA as support.
  • There are one key negative point to take note when investing in Singapore REITs:
    • The uncertainty in term of interest hike in near future remains high as Federal has started the QE tapering. Any hike in interest will affect the distribution income (reduction), NAV (value drops) and also the gearing ratio (increase) of the REIT. All of these will weaken the fundamental of the REIT and affect the REIT share price.
    • Singapore Interest Rate is creeping up quietly but you don’t see BIG news in the newspaper. Look at the % of increase in 2014, from 0.05% to 0.2% — 4X!

Singapore Interest Rate April4-2014

    • And look at the past high in 20 years! The interest rate can go to as high as 10% and average at about 4%. The current interest rate is chicken feet! There is one thing GUARANTEE that interest rate will SURE go up!  Everyone should be very cautious about the interest impact on your current investment and mortgage loan. It is extremely important to equip yourself with financial knowledge now before it is too late in you want to stay in this investing world. No excuse for financial ignorant because you are fully responsible on your own investment.Singapore Interest Rate April4-2014 (20 Years)
Continue ReadingSingapore REIT Fundamental Analysis Comparison Table – 5 April 2014

Global Stock Market Indices PE Ratio At a Glance (3 April 2014)

  • Post author:

Market Indices PE Ratio for Major Stock Exchange globally.

  • US: Dow Jones Industrial, S&P500, NASDAQ, Russell 2000
  • Europe: FTSE100, CAC40, DAX
  • Asia: KLCI, STI, HangSeng, ASX200, CSI 300, JCI, SET, KOPSI, NIKKEI 225, SENSEX, TWSE, NZX50, PSEi

Average PE ratio increases from 19.86 to 21.23 when global stock market rebounded strongly in end Mar 2014. P/B Ratio at 2.17

Mar 2014 Month Global PE Ratio.

See the compilation of Monthly Global Stock Market here.

Stock Market Key Indices PE Ratio Apr3-2014

.

Shiller PE Ratio Apr3-2014

.

S&P500 PB Ratio Apr3-2014


  • PE  = Price Per Earning
  • PB = Price To Book Value
  • Want to Learn More about how to value the stock market using PE Ratio or PB Ratio? Check out the Fundamental Analysis Class here.
Continue ReadingGlobal Stock Market Indices PE Ratio At a Glance (3 April 2014)