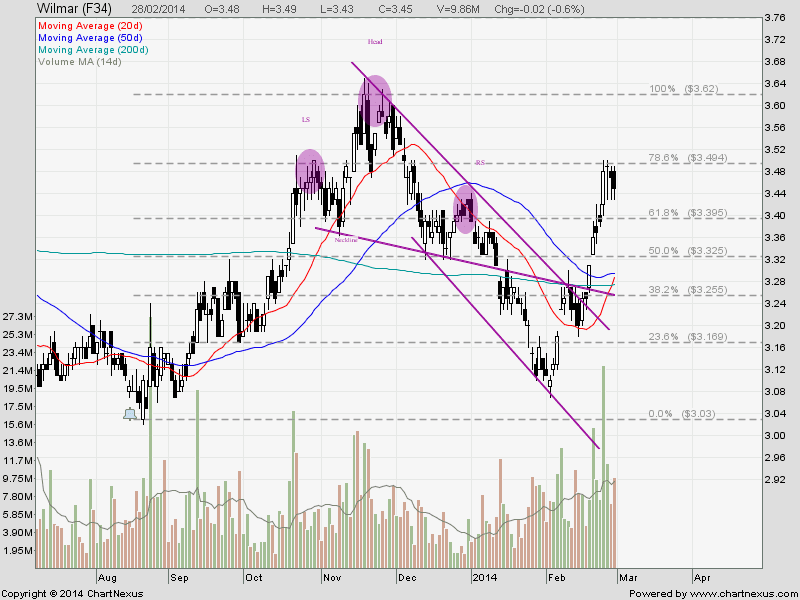
Wilmar: Facing Resistance at $3.50
Wilmar seems that hitting a tough resistance at $3.50 and unable to clear the level for the past 4 sessions. Note that there is probably a short term retracement back to the support of about $3.30 after Wilmar chart showed a Dragon Fly Doji, Hanging Man with a bearish candle. If Wilmar is able to find a good support at about $3.30 and rebound from that level, Wilmar will start an uptrend because it is a clear “Higher High, Higher Low” uptrend pattern.
Original Post by Marubozu @ My Stocks Investing Journey.
Join the Technical Analysis Workshop to learn how to identify the change of trend, when to buy or sell and derive the target price to increase the probability of winning in your trade.
| Current P/E Ratio (ttm) | 13.2110 |
|---|---|
| Estimated P/E(12/2014) | 11.7831 |
| Relative P/E vs. FSSTI | 0.9893 |
| Earnings Per Share (USD) (ttm) | 0.2060 |
| Est. EPS (USD) (12/2014) | 0.2310 |
| Est. PEG Ratio | 1.1810 |
| Market Cap (M SGD) | 22,076.82 |
| Shares Outstanding (M) | 6,399.08 |
| 30 Day Average Volume | 8,099,634 |
| Price/Book (mrq) | 1.1606 |
| Price/Sale (ttm) | 0.3949 |
| Dividend Indicated Gross Yield | 2.32% |
| Cash Dividend (SGD) | 0.0550 |
| Dividend Ex-Date | 05/02/2014 |
| 5 Year Dividend Growth | 0.37% |
| Next Earnings Announcement | 05/08/2014 |