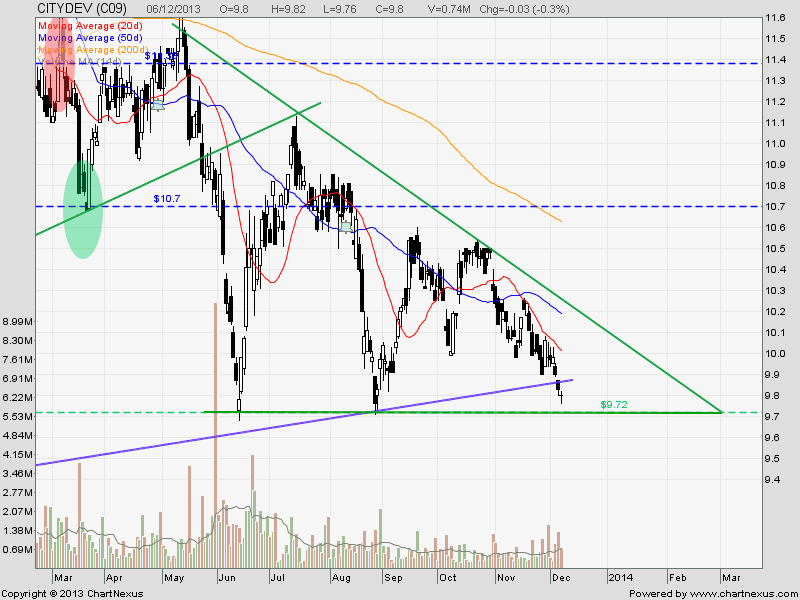
Apple (AAPL): Start Up Trend

  • Post author:

AAPL has broken the $510 resistance and currently trading in an uptrend. An “Higher High, Higher Low” up trend channel has been formed. In addition, AAPL is following a Fibonacci Expansion pattern and probably heading toward the price target of $587 (161.8% Fibonacci Retracement Level). So far the 61.8% Fibonacci Fans is providing a good support.

Check previous AAPL’s fundamental analysis and Intrinsic Value here.

Check out here if you want to learn about Fundamental Analysis and how to calculate Intrinsic Value using Discounted Cash Flow (DCF) model.

AAPL Nov17-2013

Chart from thinkorswim, get FREE chart here.

Continue ReadingApple (AAPL): Start Up Trend

Jardine C&C: Trend Reversal Coming Soon?

  • Post author:

Jardine C&C is forming a Descending Triangle with a strong support at $34.00. Jardine C&C may stop the down trend if the Triangle resistance is broken. Watch the support and resistance closely for any trading opportunities.

2013Nov18-Jardine C&C-800x600

Original post by Marubozu @ My Stocks Investing Journey.

Key Statistics for JCNC

Current P/E Ratio (ttm) 12.0406
Estimated P/E(12/2013) 10.7911
Relative P/E vs. FSSTI 0.8800
Earnings Per Share (USD) (ttm) 2.3257
Est. EPS (USD) (12/2013) 2.5950
Est. PEG Ratio 2.8398
Market Cap (M SGD) 12,414.37
Shares Outstanding (M) 355.71
30 Day Average Volume 206,933
Price/Book (mrq) 2.3836
Price/Sale (ttm) 0.4974
Dividend Indicated Gross Yield 4.39%
Cash Dividend (USD) 0.1800
Dividend Ex-Date 08/27/2013
5 Year Dividend Growth 19.21%
Next Earnings Announcement 02/28/2014
Continue ReadingJardine C&C: Trend Reversal Coming Soon?

Starhub: Trading in a Rising Wedge

  • Post author:

Starhub is currently trading in a Rising Wedge. Seems that rebound is happening at the Wedge support and 200D SMA support with a closing Marubozu candle.

2013Nov13-StarHub-800x600


Original post by Marubozu @ My Stocks Investing Journey.

Key Statistics for STH

Current P/E Ratio (ttm) 19.7520
Estimated P/E(12/2013) 19.9074
Relative P/E vs. FSSTI 1.4425
Earnings Per Share (SGD) (ttm) 0.2177
Est. EPS (SGD) (12/2013) 0.2160
Est. PEG Ratio 3.6934
Market Cap (M SGD) 7,393.65
Shares Outstanding (M) 1,719.45
30 Day Average Volume 1,955,257
Price/Book (mrq) 89.1723
Price/Sale (ttm) 3.0812
Dividend Indicated Gross Yield 4.65%
Cash Dividend (SGD) 0.0500
Dividend Ex-Date 11/13/2013
5 Year Dividend Growth 2.13%
Next Earnings Announcement 02/07/2014
Continue ReadingStarhub: Trading in a Rising Wedge