Monsanto (MON) Trade Idea

  • Post author:

Technical Analysis

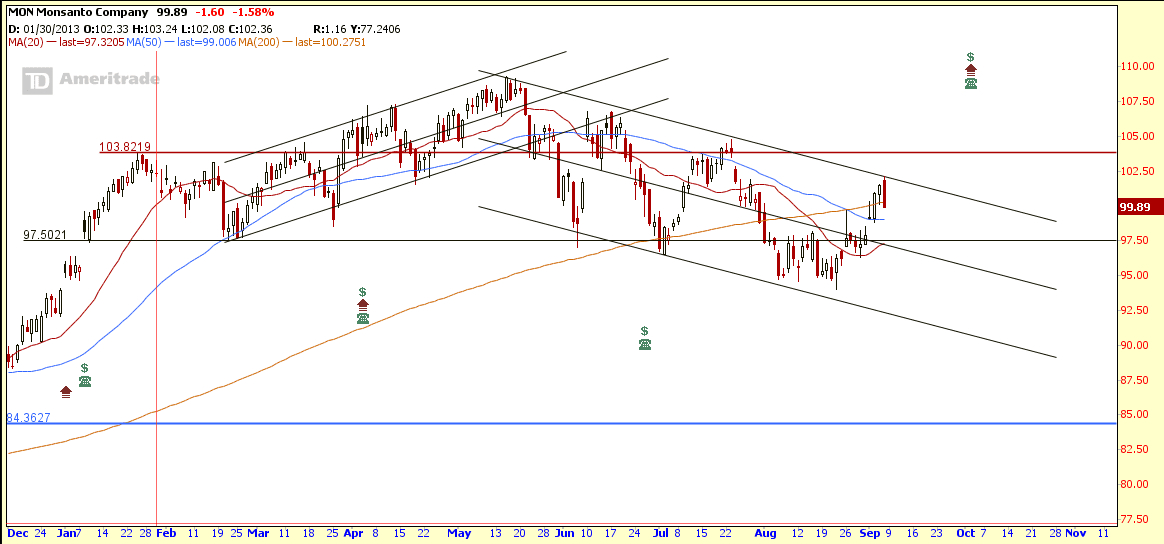
MON rebounded but rejected at the down trend channel resistance with Bearish Engulfing candlestick pattern. This is the reversal pattern. Similar trade setup as previous one except different strike price and different expiry date.

See previous analysis for Monsanto (MON) Trade idea here. This is a perfect example that we can trade the same stock again and again if you understand the stock well which has predictable chart pattern.

MON Sept6-2013

Trading Strategy: Short Call Spread 100/105

  • Direction: Bearish
  • STO MON Oct 13 100 Call
  • BTO MON Oct 13 105 Call
  • Entry: $100.86
  • Price Target: $90 by Oct expiry
  • Breakeven Price: $102.10
  • Max Profit: $840
  • Max Loss: $1160
  • Reward vs Risk: 0.72
  • Probability Price Below Breakeven: 62.45%
  • Cut loss if MON goes above $105 as the down trend channel chart pattern is no longer valid.

Chart from thinkorswim, open an account to get FREE chart here. Original post by Marubozu.


Continue ReadingMonsanto (MON) Trade Idea

Genting Singapore: Range Bound for Now BUT…..

  • Post author:

Genting Singapore is currently trading in a Rectangle Range between $1.40 and $1.32. However, technically Genting Singapore is in a bearish region where the stock price is currently trading below 20D, 50D and 200D SMA. Base on current chart pattern, upside is very limited as there are many strong resistances at $1.35 (20D/50D SMA), $1.40 (Rectangle Resistance) and $1.42 (200D SMA). Watch out for the Rectangle breakout with next support at $1.20.

Fundamentally Genting Singapore is over value base on PE ratio and PEG ratio. There is also no catalysts to favor the bull for this stock at the moment.

Original Post by Marubozu https://mystocksinvesting.com

2013Sept6-GENTING SINGAPORE PLC-800x600

Key Statistics for GENS

Current P/E Ratio (ttm) 32.6406
Estimated P/E(12/2013) 26.1765
Relative P/E vs. FSSTI 2.6190
Earnings Per Share (SGD) (ttm) 0.0409
Est. EPS (SGD) (12/2013) 0.0510
Est. PEG Ratio 1.9390
Market Cap (M SGD) 16,321.13
Shares Outstanding (M) 12,225.56
30 Day Average Volume 20,145,130
Price/Book (mrq) 2.3835
Price/Sale (ttm) 5.7399
Dividend Indicated Gross Yield 0.75%
Cash Dividend (SGD) 0.0100
Last Dividend 05/08/2013
5 Year Dividend Growth
Next Earnings Announcement 11/12/2013
Continue ReadingGenting Singapore: Range Bound for Now BUT…..

Singapore REIT Fundamental Analysis Comparison Table – 6 Sept 2013

  • Post author:

FTSE ST Real Estate Investment Trusts (FTSE ST REIT) Index changes from 749.17 to 699.17 compare to last post on Singapore REIT Fundamental Comparison Table on Aug 9, 2013. The index is trading below 200D SMA and technically bearish. Currently the index is trading in Elliott Wave C (down) and no sign of reversal yet.

 FTSE ST REIT Index Sept6-2013

Compare to last Singapore REIT comparison table:

Added Soilbuild Business REIT.

  • Price/NAV decreases from 1.0568 to 0.9763.
  • Dividend Yield increases from 5.91% to 6.41%.
  • Gearing Ratio remains the more or less the same at 33.07%.
  • In Short, Singapore REIT become attractive in terms of valuation and distribution yield again. However technically Singapore REIT is still on down trend and the price can go even lower although fundamental looks attractive.

Singapore REIT NAV Gearing Distribution Yield Comparison Table 6-Sept-2013


Find out how I do research on Singapore REIT, how to interpret those financial ratio in the comparison table, when is the best time to buy using simple Trend Analysis. Check out my next public tutorial on  “How to pick Singapore REIT for Dividend Investing” .


Continue ReadingSingapore REIT Fundamental Analysis Comparison Table – 6 Sept 2013