Are You Ready to Short Singapore REIT?
Looks for those Singapore REITs with High Gearing and Overvalue. Bet on Right issuing!
Good luck and have fun shorting! Disclaimer applied!

See Singapore REIT Fundamental Analysis Comparison table here.

Looks for those Singapore REITs with High Gearing and Overvalue. Bet on Right issuing!
Good luck and have fun shorting! Disclaimer applied!
See Singapore REIT Fundamental Analysis Comparison table here.
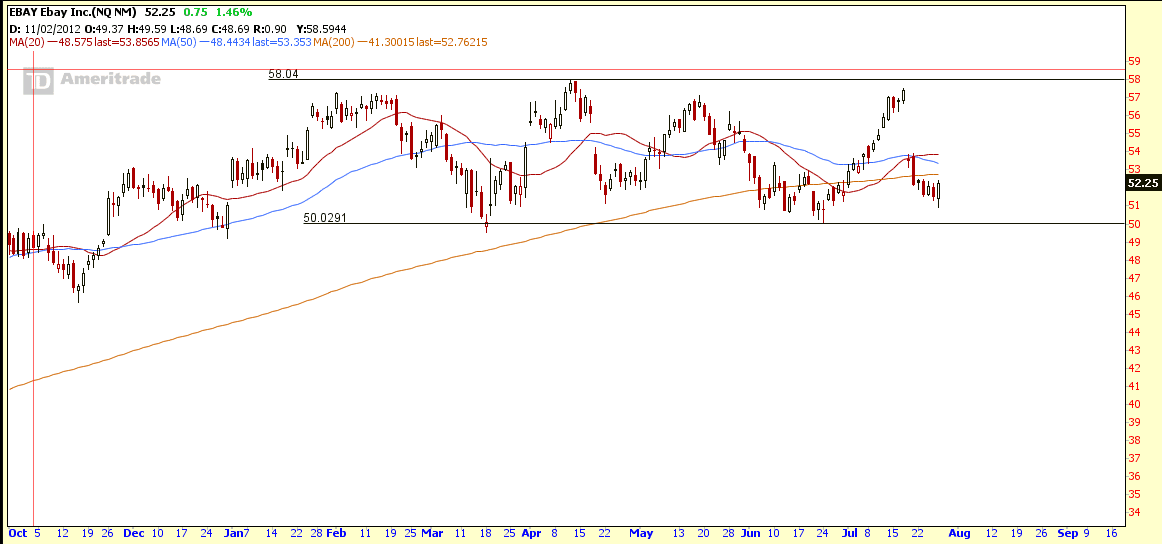
Chart Pattern: eBAY is trading within a Rectangle between $50 to $58.
Target Entry: $50 (Reliable support)
Trading Strategy: Short Put Spread 45/50
EBAY Chart
EBAY Fundamental

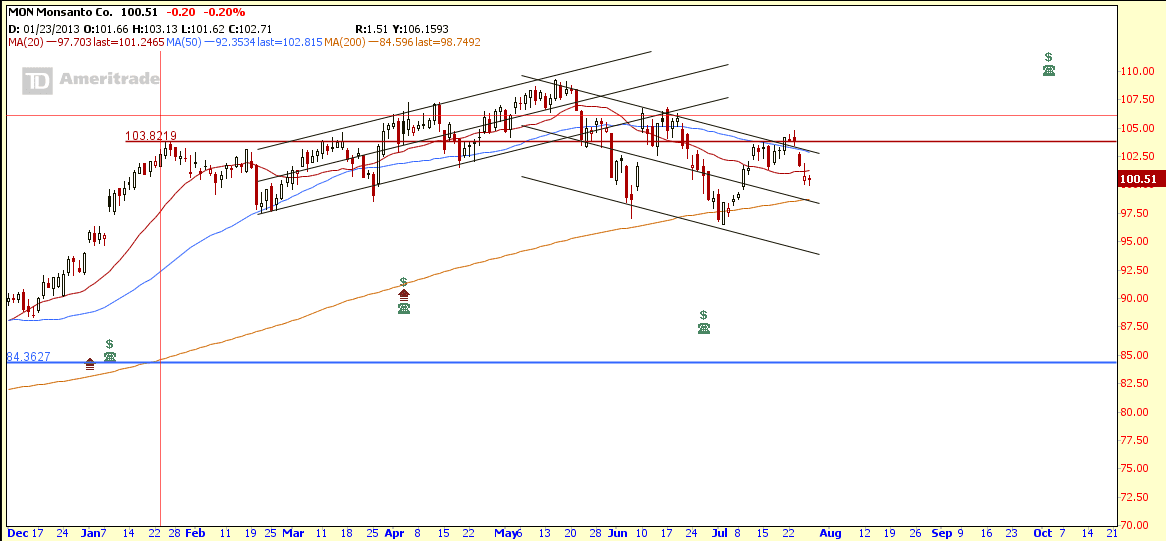
Trading Strategy: Short Call Spread 100/110
MON Chart
MON Fundamental
