About Croesus Retail Trust (CRT)
CRT is the first Asia-Pacific retail trust with an initial portfolio located in Japan to be listed on the SGX-ST. CRT’s principal investment strategy is to invest in a diversified portfolio of predominantly retail real estate assets located in the Asia-Pacific region and real estate-related assets relating to the foregoing.
Time Table:
- Roadshow: 25 April 2013, Thursday – 30 April 2013, Tuesday
- Singapore Public Offer: 03 May 2013 (9am) – 08 May 2013 (12 noon)
- Expected listing: 10 May 2013, Friday (2pm)
Disclaimer: Reading the prospectus is really a pain. I just did a quick scan and extract key information in my analysis. The calculation may not be accurate but good enough for me to have an opinion on Croesus Retain REIT to make my investment decision. Feel free to point out if there is any mistake in my calculation.
Fundamental Summary
- IPO Price = $0.93
- Projected DPU Yield = 8% (2014)
- Net assets attributable to Unit Holders = JPY 30,266,962,000 (Page 41 of CRT Prospectus)
- Number of Units = 430,178,000 (Page 40 of CRT Prospectus)
- NAV = JPY 70.36 (S$0.897) –> IPO price is 3.6% Premium to the NAV. Benchmark with Saizen REIT (27% discount). See Saizen REIT data here. Exchange Rate used (JPY78.39 =S$1.00) from Page V.
- Risks (Personal View):
- Depreciation of Japanese Yen –> will affect the DPU if Japanese Yen depreciates further due to Abenomics.
- Japan economy has been on deflation for the past 2 decades.–> Cause fallen asset price.
- Natural disaster –> Any Earth quakes or Tsunami will hit the DPU.
- Gearing Ratio = 48%
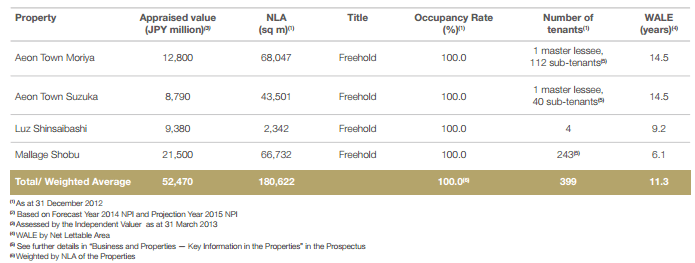
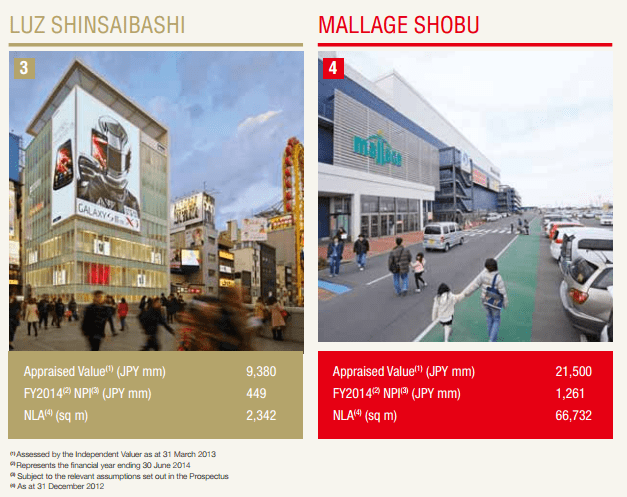
Portfolio

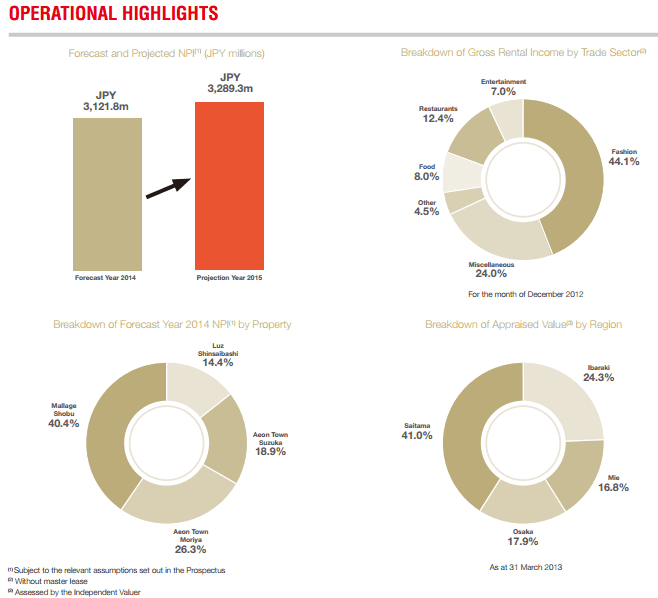
Operation Highlight
See detail Croesus Retail Trust Prospectus.


