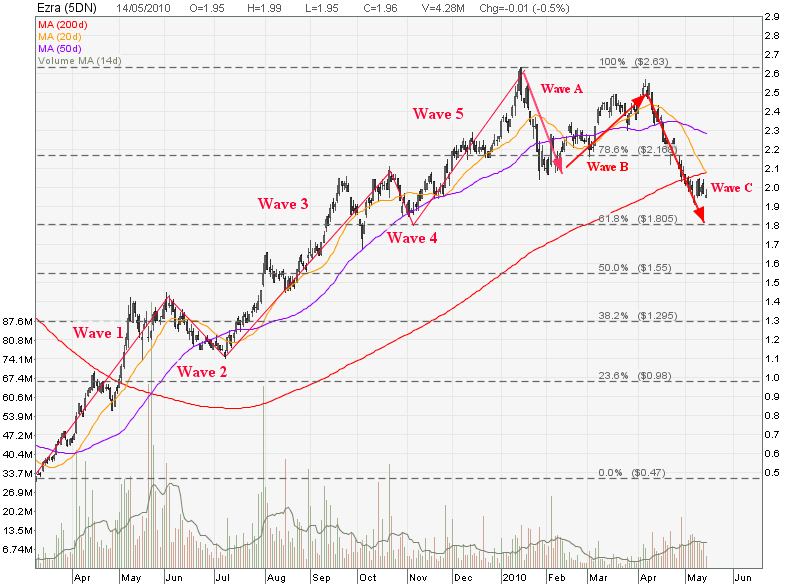
SATS – Forming a Rising Wedge
SATS is forming a Rising Wedge pattern. This Rising Wedge pattern in an up trend is a trend reversal pattern.
Technically base on the chart pattern, the upside potential is about 5.4% (from current price of $2.76 to resistance of $2.91). Downside risk is 24% (from current price of $2.76 to $2.10 price target after breaking down from Rising Wedge).
Fundamentally SATS current PE does not show much upside potential. SATS current PE is 16.65 compared to past three years average PE of 17.66.
SATS does not look attractive to me both technically and fundamentally except giving a dividend yield of 4.7%.
Golden Agri – Breaks Up Trend Support
Golden Agri has broken the up trend support level recently. The key question now is whether Golden Agri can move back up and stay above the up trend support line like what the stock did back in July 2009. If GoldenAgri cannot break this uptrend support turned resistance line, the stock will probably start a deeper correction. The next two immediate supports are $0.50 (200D MA support) and $0.456 (61.8% Fibonacci Retracement Level).
- Go to the previous page
- 1
- …
- 595
- 596
- 597
- 598
- 599
- 600
- 601
- …
- 656
- Go to the next page


