
StarHub – 5% price dropped after ex-Dividend. What next to SingTel?
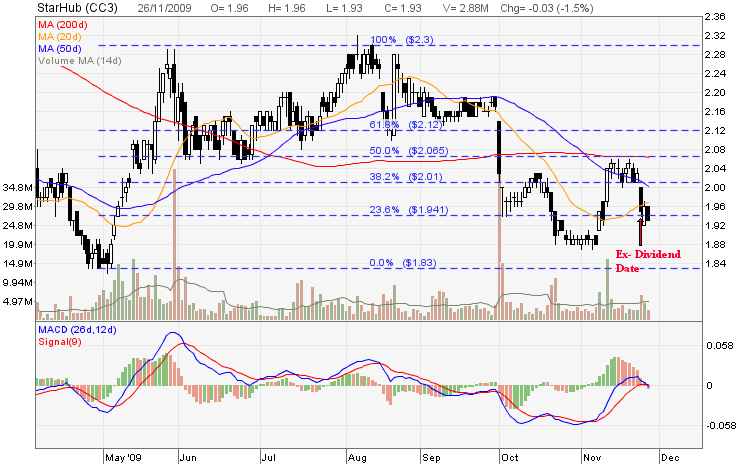
Starhub stock price dropped about 5% after ex-Dividend date on Nov 24. The stock price broke 20D and 50D MA support and looked very bearish. MACD is also showing Bearish Convergence and further down trend is expected. Next critical support is $1.83 which is very close to 52 weeks historical low of $1.76.
Base on this pattern, it is predicted that SingTel may go down to $2.75 (5% drop with reference to current $2.90 and if the stock price stays about this level) after ex-Dividend date on Dec 18. SingTel may go to bearish mode if $2.90 support is broken. This $2.90 is a very critical support where this is also the 20D MA, 50A MA and 61.8% Fibonacci Retracement Level. Last 5% price drop was observed after the ex-Dividend date on Aug 5. Would this pattern repeat on SingTel itself again?

Both charts look bearish and I am waiting for the stock price to hit bottom before buying for long term investment (for dividend collection).

