Ascendas REIT Fundamental Analysis base on April, 2015 Quarterly Earning Presentation.
- Last Done Price = $2.44
- Market Cap = $5.87 B
- NAV = $2.08
- Price / NAV = 1.17 (17% Premium)
- Price / NAV (High) = 1.55
- Price / NAV (Low) = 1.07
- Distribution Yield = 6.0%
- Gearing Ratio = 33.5%
- WADB = 3.6 Years
- WALE = 3.8 Years
- Occupancy Rate = 87.7%
Ascendas REIT Technical Analysis
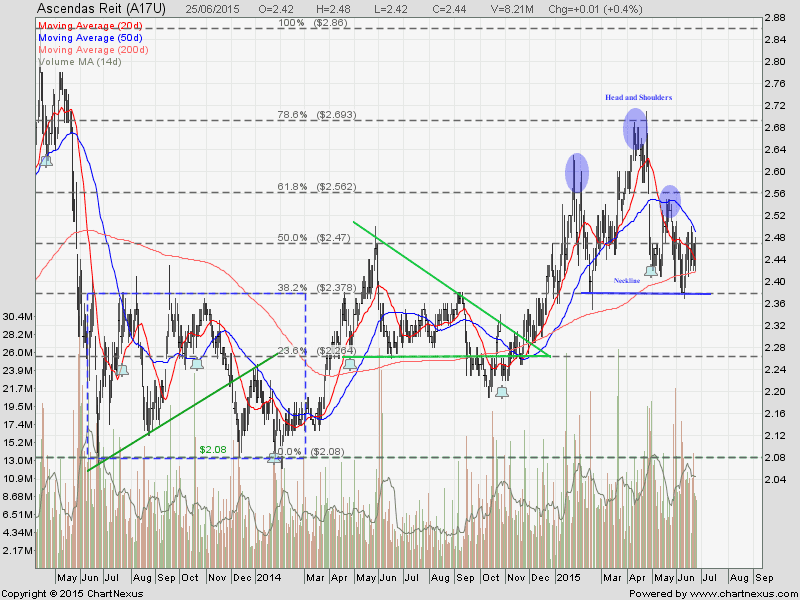
Ascendas REIT is just sitting on the 200D SMA support after dropped about 12% from the recent high. Take note that Ascendas REIT is forming a Head and Shoulders chart pattern. Breaking the 200D SMA support at $2.415 and neckline at $2.375 will send the stock price lower with price target of $2.08.
Summary
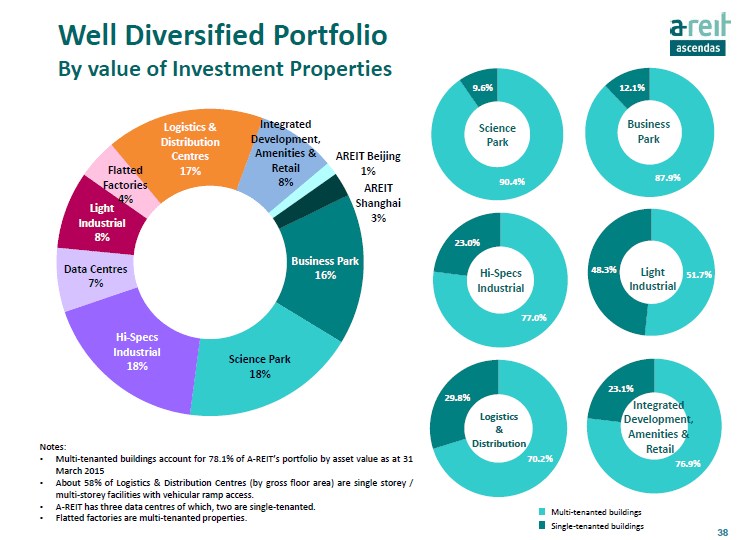
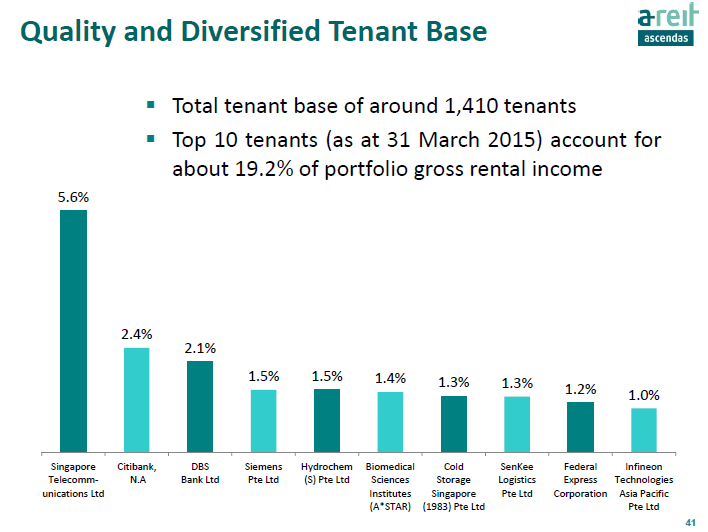
Ascendas REIT has a good fundamental and well diversified portfolio and tenant base. Currently Ascendas REIT is over value base on NAV. Technically I don’t like the chart (Head and Shoulders) amidst coming interest rate hike. So it is better to play safe now because there is opportunity to pick up this fundamental strong REIT at a lower price.


