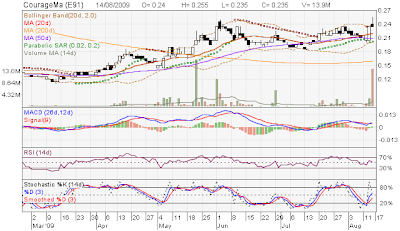
This week this counter has a very long marubozu candle and close the week at $0.235 with a volume spike of 13.9M shares traded in one day (on Aug 14). Standard Six Technical Indicators are signaling short term bullish convergence.
Week TA Summary
* Stock price above 20D, 50D and 200D MA and all three MAs are in uptrend. 20D MA crossed 50D MA.
* Stock price on the upper boundary of Bollinger Band.
* MACD crossover (blue over red) on upper half showing bullish convergence.
* Stock price on top of Parabolic SAR.
* RSI at 55%.
* Stochastic blue-red crossover in the up trend.
The chart is also having a very nice Fibonacci retracement back to $0.197 (61.8%) and should form a very strong support line. If the stock price can break the resistance of $0.25 and stay on top of $0.25 with healthy volume, it may go all the way up to $0.337 (161.8%) by Jan 2010 base on Fibonacci fan.
3 Years Historical High = $0.51
Current Price = $0.235


Happy learning! I was a newbie 6 months ago!