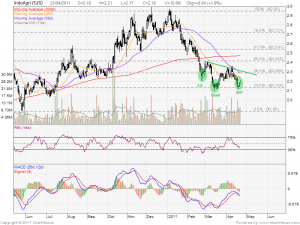
IndoAgri has a false right shoulder formation in the last analysis and did not breakout from a Inverted Head and Shoulders. Current chart looks like IndoAgri may be forming a Right Shoulder again, or a Double Bottoms with the support at $2.133. The critical resistance is at about $2.30 which is the 38.2% Fibonacci Retracement and also the 50D MA. Breaking this resistance may send IndoAgri stock price to minimum $2.54. Both Inverted Head and Shoulders & Double Bottoms chart patterns are Trend Reversal Bullish Patterns.


My thinking is IndoAgri has further downside. $1.91 is the probable target. Difficult for it sustain higher prices. Perhaps good to build short position. I have no position in this stock. Hope you dont mind me making comments
Mike, if the support at $2.13 is broken, IndoAgri will have further downside. Current chart does not suggest the stock price can reach that level. Stock chart is dynamic, we just need to keep a close watch on the support and resistance as the stock price can go either way.