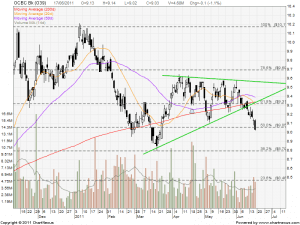
Previous Analysis is no longer valid.
OCBC has broken down from an Ascending Triangle and heading towards the price target of $8.60.
Current OCBC chart is bearish as the stock is trading below all 3 moving averages. 20D MA has crossed down 200D MA which is a down trend signal.


Price level $9.00 can’t hold for too long, a more than even chance for that to happen. With its strong fundamentals, a falling market makes OCBC more attractive, but does it mean
that the current decline would pause around the vicinity of $8.12?