
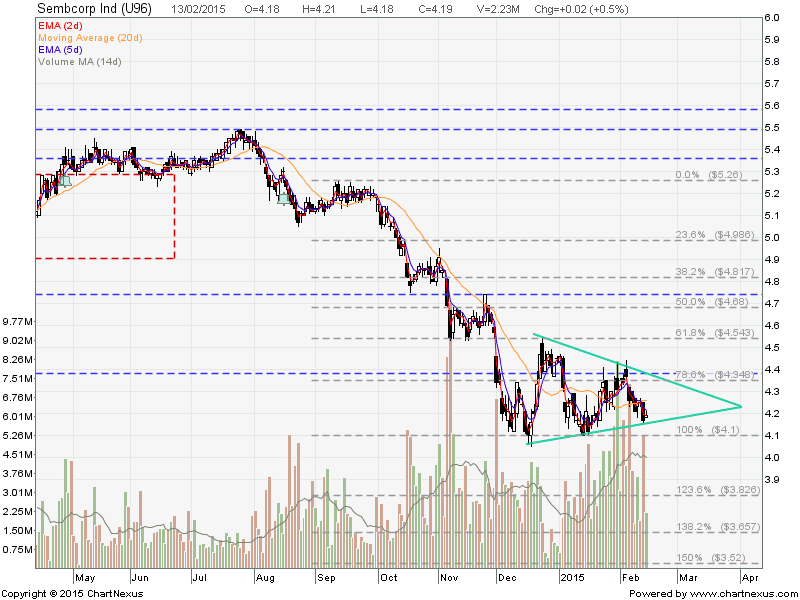
SembCorp is currently consolidating in a Symmetrical Triangle and still on the down trend.
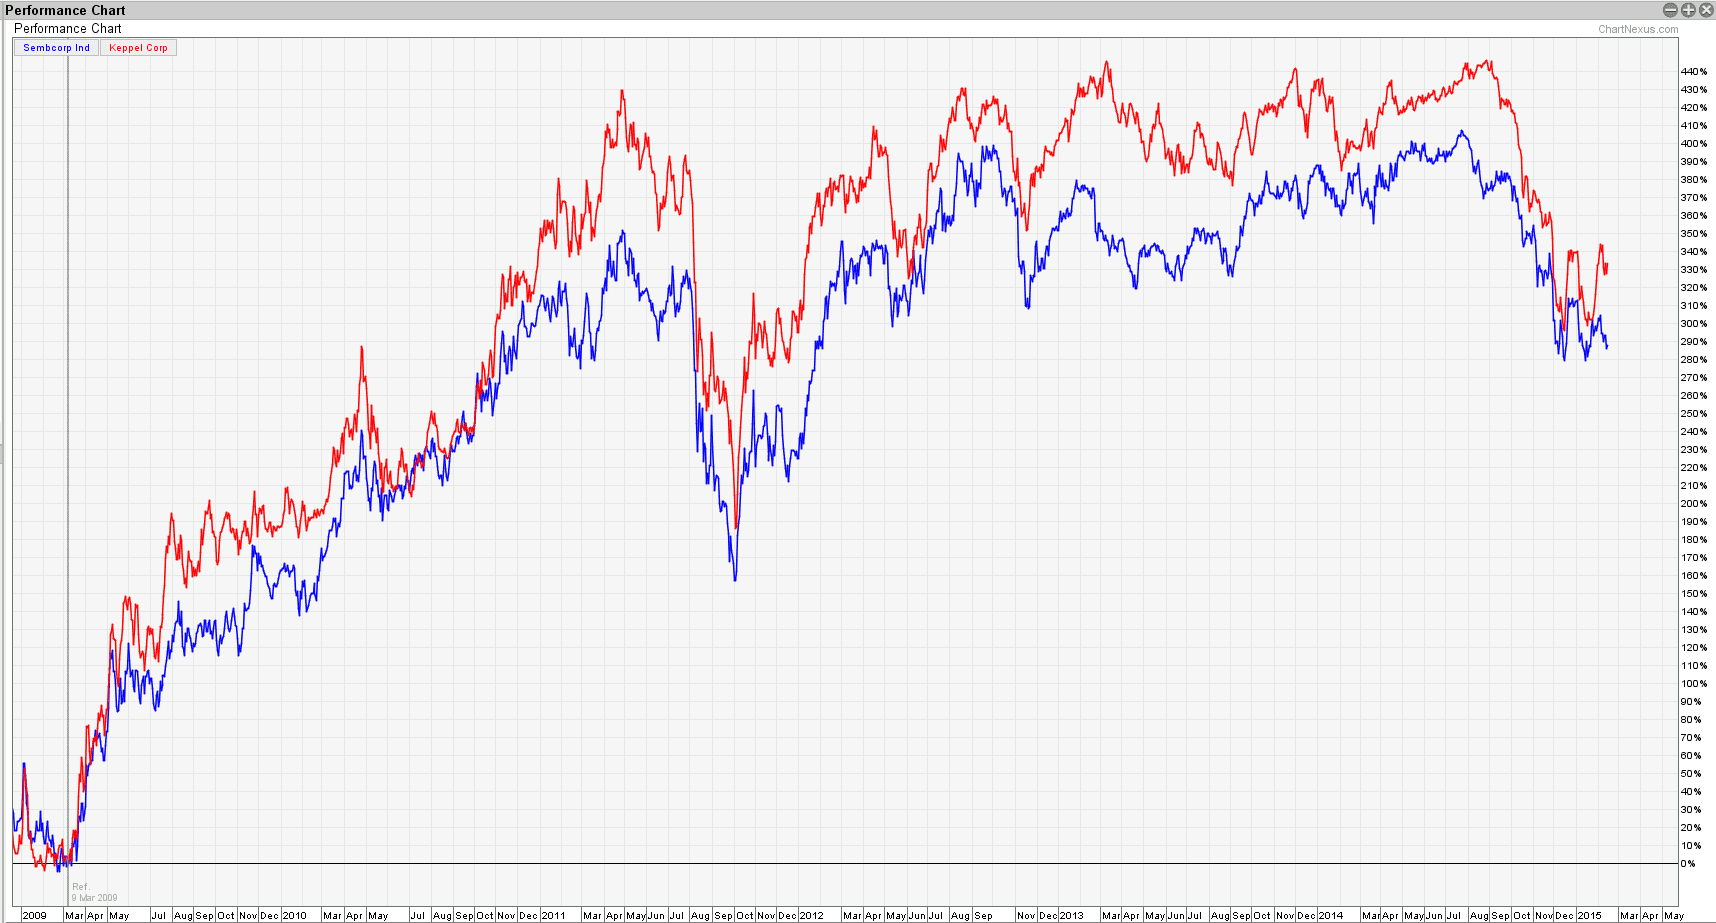
Potential Hedging Pair trade with KepCorp which has shown a trend reversal pattern of Double Bottoms. Long KepCorp and Short SembCorp.
| Current P/E Ratio (ttm) | 9.6611 |
|---|---|
| Estimated P/E(12/2014) | 9.6767 |
| Relative P/E vs. FSSTI | 0.6989 |
| Earnings Per Share (SGD) (ttm) | 0.4337 |
| Est. EPS (SGD) (12/2014) | 0.4330 |
| Est. PEG Ratio | 1.4443 |
| Market Cap (M SGD) | 7,475.11 |
| Shares Outstanding (M) | 1,784.04 |
| 30 Day Average Volume | 3,735,873 |
| Price/Book (mrq) | 1.4408 |
| Price/Sale (ttm) | 0.6679 |
| Dividend Indicated Gross Yield | 1.19% |
| Cash Dividend (SGD) | 0.0500 |
| Dividend Ex-Date | 08/15/2014 |
| 5 Year Dividend Growth | 14.87% |
| Next Earnings Announcement | 02/17/2015 |