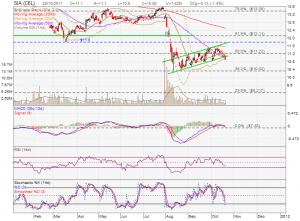
Singapore Airlines (SIA) just break the suppport and drop out from a 3 months uptrend channel. All technical indicators like MACD, RSI, Stochastic, Bollinger Band, Parabolic SAR indicates bear is coming back for SIA again. What missing now is the volume. Will this be another free fall for SIA again?
Previous Singapore Airlines Head and Shoulder chart pattern and target price.


SIA get back into the uptrend channel. Next resistance is $11.80, the uptrend channel resistance.