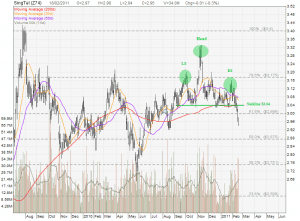
Singapore Telecom (SingTel) broke the Neckline of a complicated Head and Shoulders Pattern at $3.04. The price target of this breakdown is at least $2.875 or below. Take note that SingTel has started the down trend as the stock is currently trading below 20D, 50D and 200D MA. Singtel has also broken the 61.8% Fibonacci Support at about $3.00. Bear is clearly in charge in this SingTel stock chart for the time being.


I think at this juncture, we re talking about one of the biggest sti components having a bear market. how low do you think we should be picking up. I would say 2.80 is not a bad point to evaluate.
here is my fundamental take to supplement your technical take on Singtel >> http://www.investmentmoats.com/money-management/dividend-investing/stock-analysis-singtels-q3-11-more-vc-and-innovation-initiatives/
More or less agree that we can take a look on SingTel again when the stock reaches $2.80. More importantly is not to enter the stock while it is on down trend. We can pick up cheaper at later stage.
i think perhaps thats where we differ cause for such a stock that trades within a price range and recession resistent we should pick it up here and there. 2.50 will be good because the yield will be around 6%
I am eyeing at $2.50! 😀
lets hope it really hits that amount!