
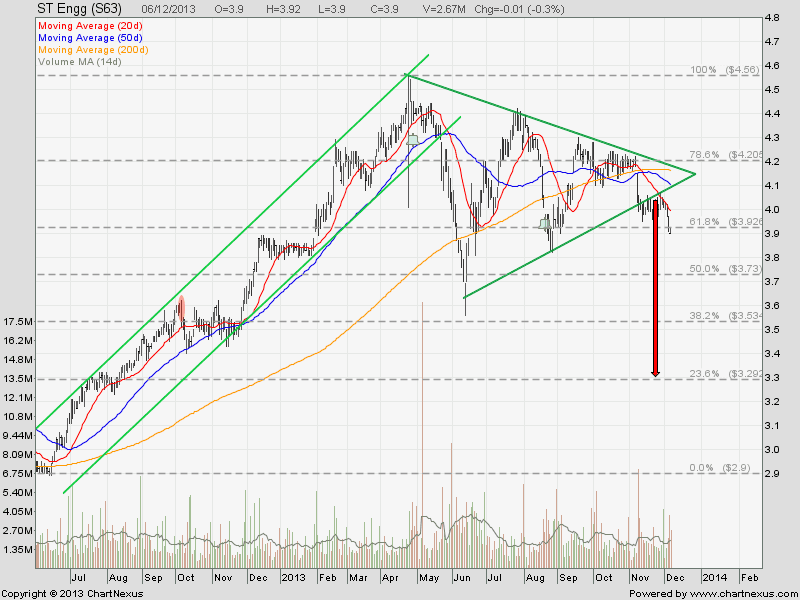
ST Engineering looks like breaking out from the Symmetrical Triangle with price target of $3.30. Stock price is currently trading below all the 3 moving averages which are also trending down. Sit tight and get ready for the fall!
See previous analysis on ST Engineering.
Key Statistics for STE
| Current P/E Ratio (ttm) | 21.3231 |
|---|---|
| Estimated P/E(12/2013) | 20.5263 |
| Relative P/E vs. FSSTI | 1.6020 |
| Earnings Per Share (SGD) (ttm) | 0.1829 |
| Est. EPS (SGD) (12/2013) | 0.1900 |
| Est. PEG Ratio | 4.2763 |
| Market Cap (M SGD) | 12,112.33 |
| Shares Outstanding (M) | 3,105.72 |
| 30 Day Average Volume | 2,065,833 |
| Price/Book (mrq) | 6.3199 |
| Price/Sale (ttm) | 1.8779 |
| Dividend Indicated Gross Yield | 1.79% |
| Cash Dividend (SGD) | 0.0300 |
| Dividend Ex-Date | 08/21/2013 |
| 5 Year Dividend Growth | -1.24% |
| Next Earnings Announcement | 02/14/2014 |