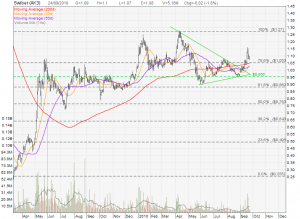
Follow up on Swiber last analysis. Swiber looks like breaking out from a Descending Triangle. Currently Swiber retraces back to test the support at the breakout point at about $1.05. This is a very important four-in-one support where 20D, 50D, 200D MA and 78.6% Fibonacci Retracement Level meet at this level.
Things to watch out for:
- Look for trend reversal candlesticks when rebound from this support level.
- If Swiber reverses and breaks the recent new high of $1.15, the breakout is successful and the price target is about $1.30.


I don’t have an opinon on this and I’m undecided on my stance because I can see conflicting technical evidence.
For breakout from triangle, I’d say I’m definitely not convinced.
For breakout from horizontal resistance at $1.07, it looks convincing with 2 straight days of high volume.
However, an Evening Star bearish reversal pattern was formed, so the bulls won’t like to see that.
The first 2 days of the breakout had high volume, but now the price has gone down. Half the people who bought on the first day and EVERY SINGLE person who bought on the second day of the breakout are now holding onto a losing position. That’s a lot of people holding on to a losing position, and if they all decided they’ve had enough and head for the exit…
The weekly candlestick is a massive shooting star with heavy volume. The bulls are not going to like seeing that either.