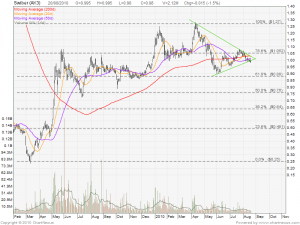
Swiber is currently trading in a Symmetrical Triangle and looks like going to breakdown. Technical indicators are showing weakness:
- Stock Price is trading under 20D, 50D and 200D MA.
- MACD is Bearish Convergence.
- Stock price is getting close to the lower band of Bollinger Band.
- RSI and Stochastic are not bullish at all.
- Stock Price is trading under the Parabolic SAR.
Base on current chart pattern and technical indicators, it looks like Swiber has higher chance of breaking down. Price target of breakdown from this Symmetrical Triangle is $0.64.

