
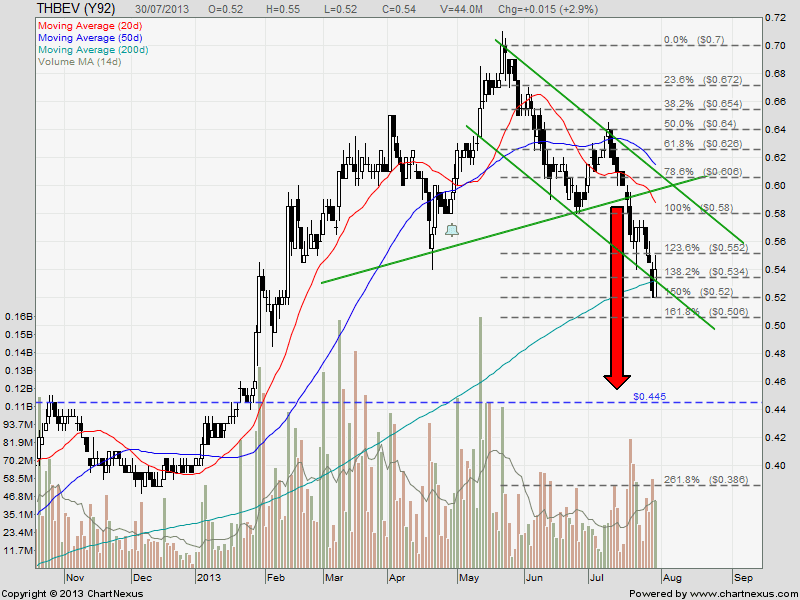
Thai Beverage (THBEV) is currently trading in a down trend channel after breaking down from a Head and Shoulders. The price target of this breakdown is about $0.45. THBEV may rebound from the 200D SMA support back to neckline support turned resistance between $0.58 to $0.60 (also the down trend channel resistance and both 20D/50D SMA), before continue the drop to price target.
Key Statistics for THBEV
| Current P/E Ratio (ttm) | 12.0905 |
|---|---|
| Estimated P/E(12/2013) | 17.1601 |
| Relative P/E vs. FSSTI | 0.9106 |
| Earnings Per Share (THB) (ttm) | 1.1000 |
| Est. EPS (THB) (12/2013) | 0.7750 |
| Est. PEG Ratio | 1.4060 |
| Market Cap (M SGD) | 13,559.41 |
| Shares Outstanding (M) | 25,110.03 |
| 30 Day Average Volume | 34,995,670 |
| Price/Book (mrq) | 3.8272 |
| Price/Sale (ttm) | 2.0914 |
| Dividend Indicated Gross Yield | 3.22% |
| Cash Dividend (THB) | 0.2520 |
| Last Dividend | 04/29/2013 |
| 5 Year Dividend Growth | 6.66% |
| Next Earnings Announcement | 08/14/2013 |