Genting: Short Term Bullish Trade?

  • Post author:

Base on current daily chart, Genting SP looks like forming a Bullish Pennant and trading within an uptrend channel. 2/5 EMA are showing bullish signal on both daily and weekly chart. Currently Genting SP is just sitting on the 50D SMA and seems like a good support so far.

Looks like a good opportunity to have a very short trade (bullish trade) with price target of $1.46 (161.8% Fibonacci Retracement Level). Note: Genting Singapore is still on long term down trend where 200D SMA is still trending down.


Continue ReadingGenting: Short Term Bullish Trade?

Capitaland: Elliott Wave 5 Now?

  • Post author:

Capitaland has been following a nice Elliott Wave with nice Fibonacci Retracement (61.8%, 161.8%). There is a change to have an almost perfect Elliott Wave 1-5 pattern if Capitaland can stay above the 20D SMA to reach the 261.8% target of $3.31. Alternatively, if Capitaland break the uptrend channel support & 20D SMA at about $3.00, the Elliott Wave has to be redrawn to be Wave C.

  • Immediate Resistance to watch: $3.15
  • Immediate Support to watch: $3.00


Key Statistics for CAPL

Current P/E Ratio (ttm) 12.1344
Estimated P/E (12/2012 ) 21.4685
Earnings Per Share (SGD) (ttm) 0.2530
Est. EPS (SGD) (12/2012) 0.1430
Est. PEG Ratio 0.7878
Market Cap (M SGD) 13,048.96
Shares Outstanding (M) 4,250.47
Enterprise Value (M SGD) (ttm) 25,638.30
Enterprise Value/EBITDA (ttm) 35.08
Price/Book (mrq) 0.8632
Price/Sale (ttm) 4.1151
Dividend Indicated Gross Yield 1.9544
Next Earnings Announcement 10/19/2012
Continue ReadingCapitaland: Elliott Wave 5 Now?

How Low Can Facebook (FB) goes?

  • Post author:

Is it good time to buy Facebook now after dropping 50% since the IPO? Personally I don’t feel it is the right time to long the stock yet base on both Technical and Fundamental Analysis. However, it is a RIGHT time to short Facebook instead because fundamentally FB is over value and technically FB is bearish and continue down trend without any support base on history! So, how low can Facebook go and when is the right entry level? Hmmm… I don’t have the answer and I will let the chart to tell me.

Technically Facebook has broken the $20 psychological support and the previous support, after rebound from the 61.8% Fibonacci Resistance. The next target price for FB is 161.8% Fibonacci Retracement level at $13.95.
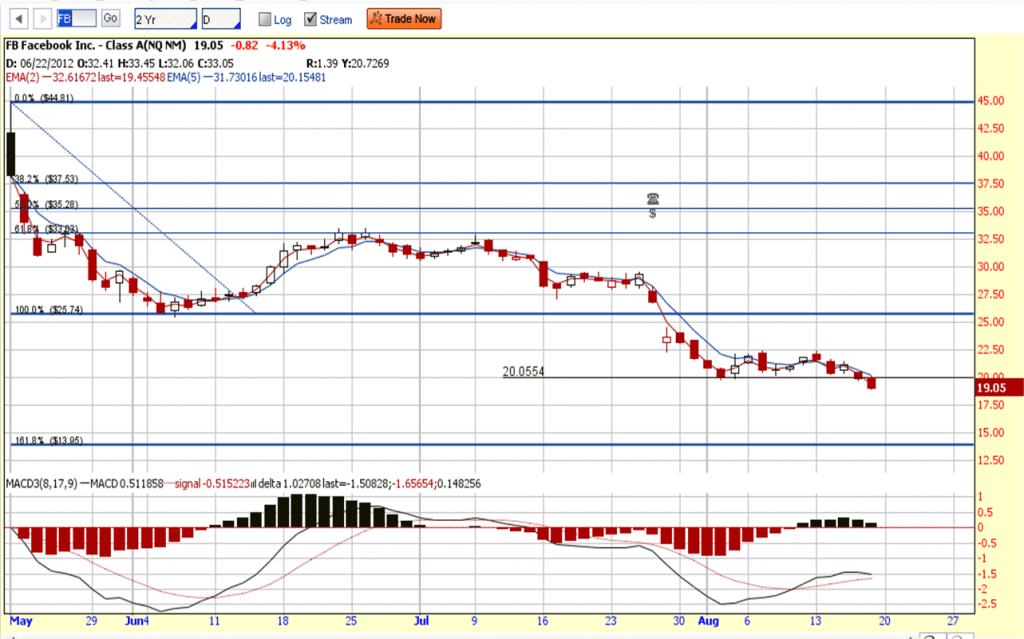
 

Fundamentally Facebook (FB) is over value base on PE Ratio & PEG.

Key Statistics for FB

Current P/E Ratio (ttm) 41.4130
Estimated P/E (12/2012 ) 38.7195
Earnings Per Share (USD) (ttm) 0.4600
Est. EPS (USD) (12/2012) 0.4920
Est. PEG Ratio 1.5613
Market Cap (M USD) 46,012.75
Shares Outstanding (M) 674.61
Enterprise Value (M USD) (ttm) 36,530.75
Enterprise Value/EBITDA (ttm)
Price/Book (mrq) 5.9142
Price/Sale (ttm) 6.6426
Dividend Indicated Gross Yield
Next Earnings Announcement 10/25/2012
Continue ReadingHow Low Can Facebook (FB) goes?